
Your machine learning model worked perfectly in the lab, but in the real world, its performance is silently degrading. This is a common, costly problem caused by data drift, concept drift, and unexpected input shifts. Without a dedicated system to watch over it, your AI's predictions can become inaccurate, biased, and unreliable, directly impacting business outcomes and user trust. The solution is robust model monitoring, a critical MLOps practice that provides real-time visibility into your model's health and performance post-deployment.
This guide is a comprehensive resource for finding the best machine learning model monitoring tools for your specific needs. We move beyond marketing copy to provide a detailed, practical breakdown of the top platforms available today. Whether you're a startup founder building an MVP, a product manager at a mid-sized company, or part of an enterprise ML team, this list will help you navigate the complex landscape of MLOps solutions. We've analyzed each tool based on its core features, ideal use cases, and implementation complexity.
You'll find in-depth reviews of leading platforms like Arize AI, Fiddler, and Evidently AI, alongside observability solutions from major cloud providers like AWS, Google Cloud, and Azure. Each entry includes direct links, screenshots, and an honest assessment of pros and cons to help you make an informed decision quickly. Our goal is to equip you with the information needed to select a tool that prevents model degradation, ensures accountability, and helps you maintain peak AI performance in production.
1. Arize AI
Arize AI positions itself as a unified observability platform, making it one of the most comprehensive machine learning model monitoring tools for teams working with both traditional ML and modern Large Language Model (LLM) applications. Its key strength lies in bridging the gap between statistical performance metrics and generative AI evaluation, allowing users to monitor everything from classification model drift to LLM hallucinations and costs within a single interface. This comprehensive view is essential for modern AI stacks where predictive and generative models often coexist. The platform's ability to troubleshoot issues quickly, from performance degradation in a fraud detection model to unexpected behavior in a customer service chatbot, provides immense value by reducing downtime and maintaining user trust.
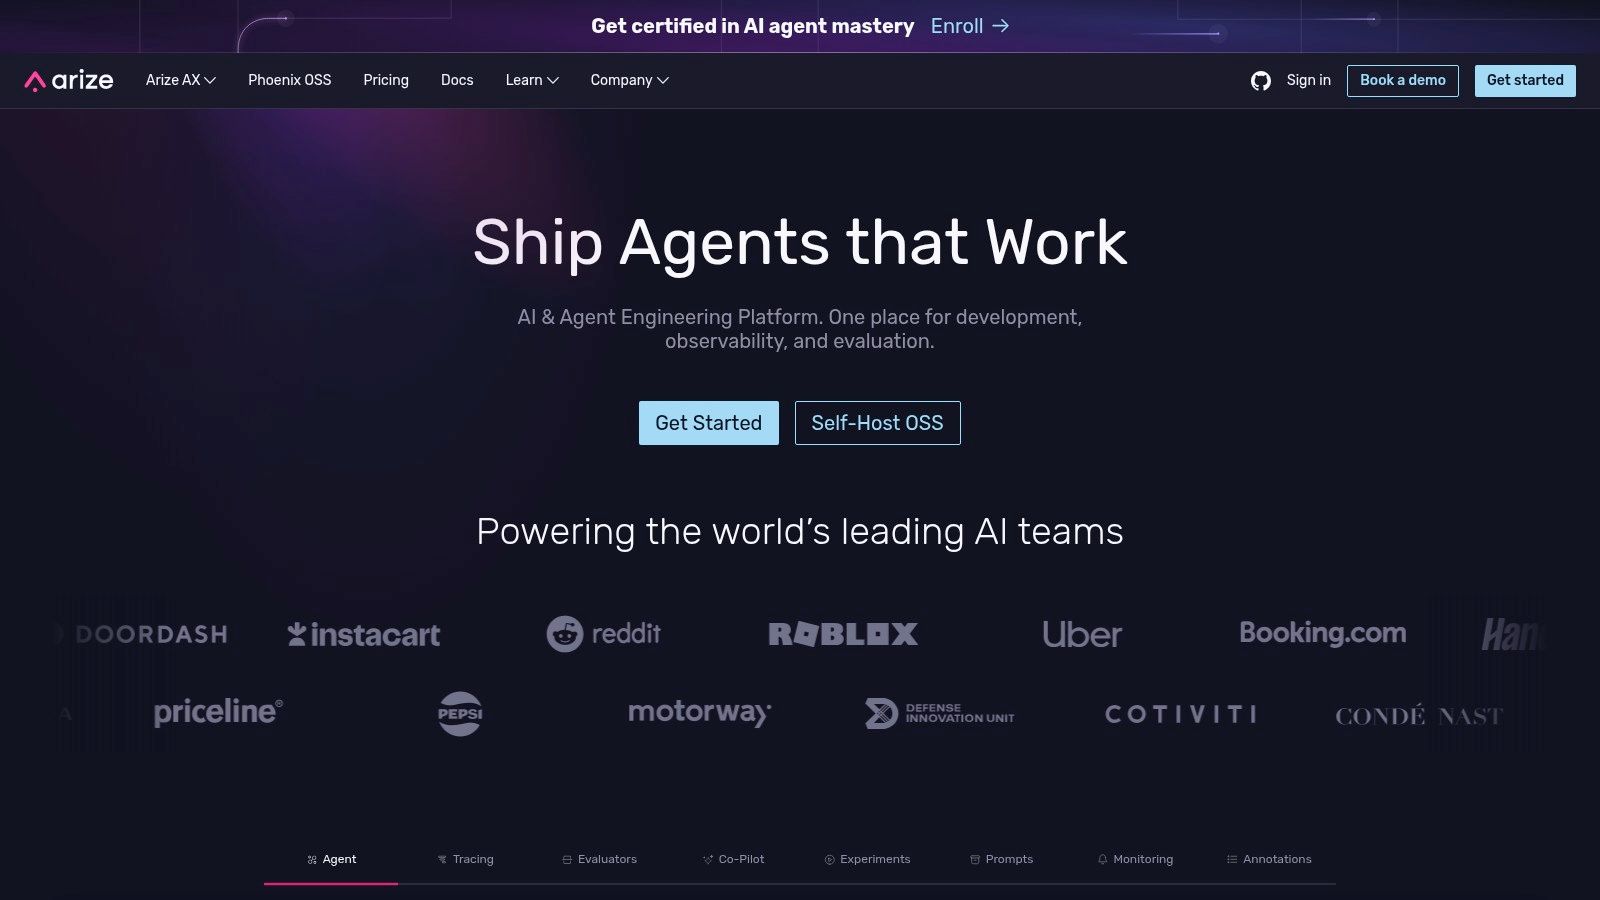
The platform offers a powerful combination of an open-source library, Phoenix, for local evaluation and a scalable cloud product, Arize AX. This dual approach provides flexibility, letting developers debug and experiment on their local machines before pushing monitoring configurations to a production environment. For LLM applications, its native OpenTelemetry support simplifies tracing, helping teams visualize complex chains and pinpoint sources of latency or failure. This is particularly useful for debugging Retrieval-Augmented Generation (RAG) systems, where a problem could originate from the retriever, the LLM, or the underlying data source.
Key Features & Use Cases
- Unified Monitoring: Track data drift, performance degradation, and data quality issues for both predictive models (e.g., fraud detection) and generative models (e.g., RAG systems).
- LLM Observability: Includes specialized features like token and cost tracking, prompt-response tracing, and both offline and online evaluations using techniques like LLM-as-a-judge.
- Root Cause Analysis: The platform excels at helping users move from detecting an issue (like a spike in drift) to understanding the "why" by slicing data across specific feature segments.
Pricing & Implementation
Arize offers a transparent tiered structure that accommodates different scales: a Free tier for individuals and small projects, a Pro tier for growing teams needing higher data volumes and longer retention, and a custom Enterprise tier. Implementation is SDK-based and integrates smoothly with major MLOps frameworks. A key consideration is that high-volume tracing and frequent data logging can quickly push usage beyond the free tier limits, necessitating an upgrade to a paid plan.
- Website: https://arize.com
2. Fiddler AI
Fiddler AI distinguishes itself as a responsible AI platform, placing a heavy emphasis on governance, explainability, and fairness. It's one of the few machine learning model monitoring tools designed from the ground up to serve highly regulated industries like finance and healthcare, offering both a SaaS and on-premise deployment option. The platform provides a holistic view of model behavior, combining performance monitoring with deep, actionable insights into model decisions. This focus on responsibility is not just a compliance checkbox; it builds trust with end-users and stakeholders by making opaque "black box" models more transparent and auditable.
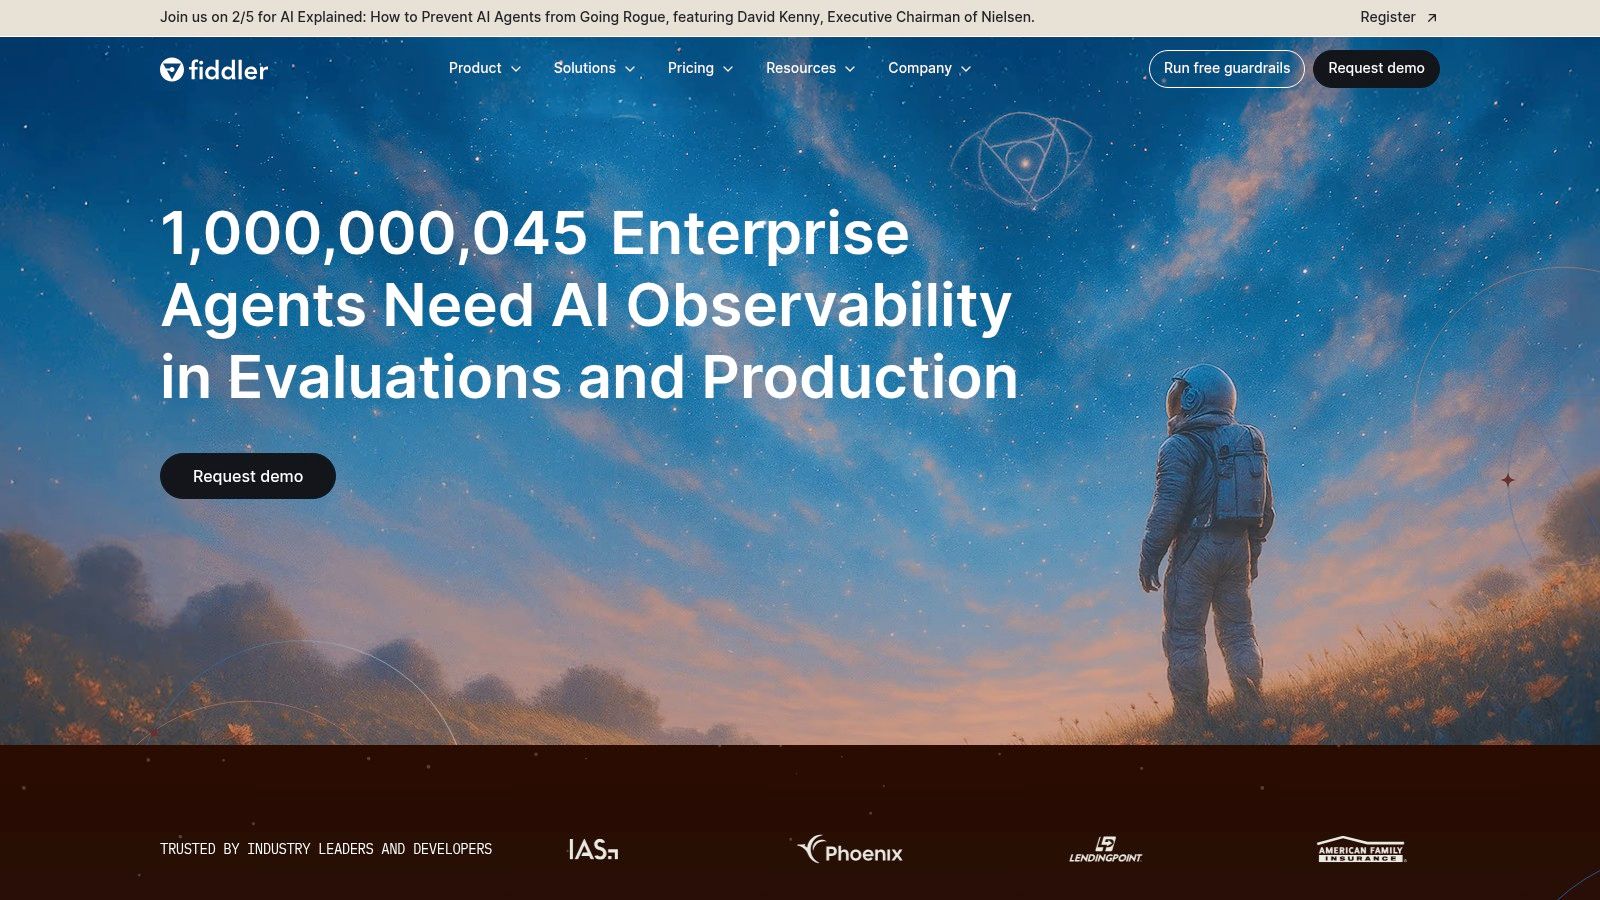
Its core strength lies in its powerful explainability engine, which uses methods like SHAP and Integrated Gradients to provide both local and global explanations for model predictions. For generative AI, Fiddler’s LLM Trust Service offers real-time guardrails to detect and mitigate risks like hallucinations, toxicity, and PII leakage. This makes it an ideal choice for enterprises where model transparency and compliance are non-negotiable business requirements. For example, a bank using an ML model for loan approvals can use Fiddler to not only monitor the model's accuracy but also explain why a specific applicant was denied, ensuring regulatory compliance.
Key Features & Use Cases
- Deep Explainability: Go beyond simple monitoring to understand why a model made a specific decision, crucial for debugging and building trust with stakeholders.
- LLM Governance & Guardrails: Implement real-time checks for LLM applications to prevent harmful outputs, detect jailbreak attempts, and ensure responsible AI usage.
- Enterprise-Grade Security: Supports on-premise deployment, role-based access control (RBAC), and SSO, meeting the stringent security needs of large organizations.
Pricing & Implementation
Fiddler’s pricing is primarily targeted at enterprise customers and is not publicly listed, requiring engagement with their sales team for a custom quote. This model reflects its focus on complex, high-stakes deployments. While the platform is incredibly powerful, its feature-rich UI can present a learning curve for new users. The implementation is SDK-based, but the on-premise option requires more significant IT involvement compared to cloud-native tools.
- Website: https://www.fiddler.ai
3. Evidently AI
Evidently AI stands out as a powerful open-source-first option among machine learning model monitoring tools, designed for evaluating, testing, and monitoring both ML and LLM systems. Its core strength is the comprehensive library of over 100 built-in metrics and interactive visual dashboards, which can be generated directly within a Jupyter notebook or deployed as a persistent monitoring service. This makes it incredibly accessible for developers and data scientists who want to start analyzing model quality and drift without a complex setup. The ability to generate a rich HTML report with a few lines of Python code is a significant productivity booster during the development phase.
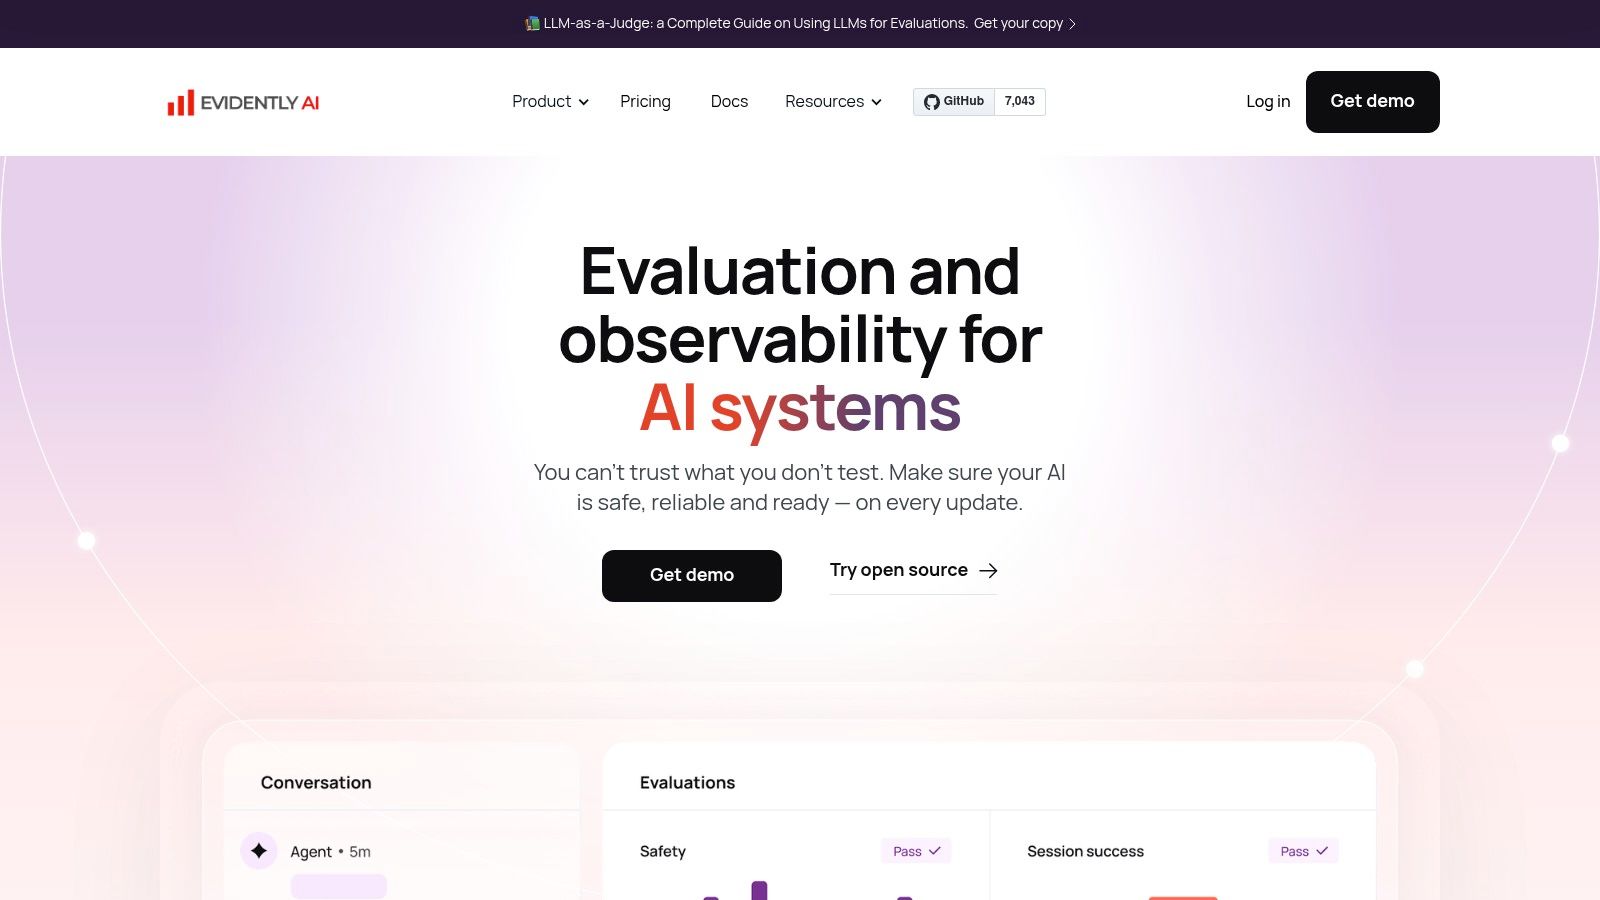
The platform offers a dual-delivery model: a flexible, self-hosted open-source library and a managed cloud solution. This allows teams to begin with the free library for initial model validation and easily scale to the cloud version for collaborative, production-grade monitoring with alerting and centralized dashboards. This scalability is a key differentiator, appealing to a wide range of users from solo developers to larger enterprises looking to integrate robust monitoring into their MLOps workflows. This seamless upgrade path removes the friction often associated with migrating from a development tool to a production system.
Key Features & Use Cases
- Comprehensive Test Suites: Define and run batch tests for data drift, model quality, and data quality as part of a CI/CD pipeline, ensuring models meet quality standards before deployment.
- Interactive Dashboards: Generate detailed visual reports to analyze model performance, compare different model versions, or monitor live production models for issues like concept drift.
- LLM Evaluation: Provides specific tools for monitoring LLMs, including support for LLM-as-a-judge evaluations and tracking key metrics for generative applications.
Pricing & Implementation
Evidently AI has a transparent, developer-friendly pricing structure. It starts with a Free open-source library that is fully-featured for local use. For production monitoring, the Cloud version offers a free Developer tier, a Team tier for collaborative projects, and a custom Enterprise plan. Implementation is straightforward using its Python library. A consideration is that integrating the open-source version into a fully automated production pipeline requires some DevOps expertise, a common challenge in DevOps for startups that are building out their MLOps stack.
- Website: https://www.evidentlyai.com
4. Deepchecks
Deepchecks stands out by bridging the gap between open-source flexibility and managed cloud convenience, establishing itself as a powerful suite of machine learning model monitoring tools. It focuses heavily on testing and validation throughout the ML lifecycle, from development to production. Its core strength is its open-source library, which provides a rich set of predefined "checks" for data integrity, drift, and model performance, making it easy for developers to validate their work locally before deployment. This "shift-left" approach to model quality, where testing is integrated early in the development cycle, helps prevent costly errors from reaching production.
This dual-offering approach allows teams to start with the open-source version for initial projects and seamlessly transition to the managed cloud service as their needs scale. The platform supports tabular, NLP, and computer vision models, offering continuous validation that ensures models in production behave as expected. Its emphasis on comprehensive testing suites helps prevent common production failures by catching issues early. For example, a team could define a test suite that automatically fails a CI/CD build if significant data drift is detected between the new training data and the production data, ensuring model robustness.
Key Features & Use Cases
- Continuous Validation: Implements comprehensive data and model checks that can be run in CI/CD pipelines, notebooks, or as part of a production monitoring system.
- Open-Source and Cloud Duality: Start with a self-hosted, AGPL-licensed open-source package and scale to a managed SaaS platform for enterprise features like alerting and multi-model dashboards.
- Root Cause Analysis: Provides detailed dashboards and segment analysis to help users quickly identify the specific data slices or features causing performance degradation or drift.
Pricing & Implementation
Deepchecks offers a clear pricing model, including a Free community cloud tier suitable for a single user and model. The Startup and Business tiers provide more capacity, users, and features like custom checks and advanced user management. The open-source version is self-hostable, though the AGPL license is a key consideration for commercial use, and scaling beyond a single model per instance requires more setup. Implementation is straightforward with well-documented Python SDKs and quickstart guides.
- Website: https://www.deepchecks.com
5. Superwise
Superwise positions itself as an AI governance and observability platform, differentiating itself by emphasizing runtime guardrails and real-time policy enforcement alongside traditional monitoring. This makes it one of the more security-focused machine learning model monitoring tools on the market, designed for organizations where compliance, fairness, and threat detection are as critical as statistical performance. Its core strength lies in translating abstract governance policies into concrete, automated actions that protect models in production. Instead of just alerting on bias, Superwise can be configured to actively flag or even block biased predictions in real time.
The platform is built to provide immediate, actionable alerts on policy violations, data integrity issues, and potential threats. Its architecture supports flexible deployments, including a multi-tenant SaaS for quick onboarding, as well as isolated or fully private SaaS options for enterprises needing enhanced data security and control. This makes it an attractive choice for teams in regulated industries like finance or healthcare that must adhere to strict data governance standards while operationalizing AI. The ability to create custom policies for things like data schema validation or adversarial input detection adds a robust layer of defense.
Key Features & Use Cases
- Runtime Guardrails: Define and enforce policies in real time to automatically flag or block problematic predictions related to bias, security, or operational thresholds.
- Threat & Policy Monitoring: Track model behavior against pre-set policies, providing clear dashboards on violations and threat levels, ideal for compliance and risk management.
- Flexible Deployment: Offers standard SaaS, isolated SaaS, and private SaaS deployments to meet various enterprise security and data residency requirements.
Pricing & Implementation
Superwise provides a tiered model starting with a Starter tier for free pilots, a Professional tier for production use, and a custom Enterprise tier that includes features like SSO and deployment isolation. Implementation is SDK-based and designed for straightforward integration. A key consideration is its focus on governance; teams needing exceptionally deep statistical drift analysis may find it less comprehensive than specialized observability tools. Additionally, lower-tier plans come with API call limits, which could be a constraint for high-throughput applications.
- Website: https://superwise.ai
6. Datadog LLM Observability
Datadog extends its well-established enterprise observability platform into the AI space, making it one of the most integrated machine learning model monitoring tools for teams already embedded in its ecosystem. Its core value proposition is unifying application, infrastructure, and AI monitoring signals into a single console. This allows engineering teams to correlate an LLM’s performance degradation, like increased latency or toxicity, directly with underlying infrastructure issues or application code changes, simplifying root cause analysis. Imagine debugging a slow chatbot and being able to see, in one place, that the root cause is a database query timeout triggered by the LLM's request, not the model itself.
The platform is designed for DevOps and MLOps teams who prioritize platform consolidation. It provides detailed tracing for LLM prompts and responses, including complex agentic workflows, and offers out-of-the-box evaluations for critical issues like hallucinations, toxicity, and sensitive data exposure. By leveraging its existing agent-based architecture, Datadog makes it relatively straightforward for current users to add LLM monitoring without introducing an entirely new tool into their stack. This consolidation reduces tool sprawl and cognitive overhead for engineering teams.
Key Features & Use Cases
- Unified Observability: Correlate AI model metrics (cost, quality, performance) with traditional APM, logs, and infrastructure telemetry within the same dashboards.
- LLM Tracing & Evaluation: Visualize and debug complex LLM chains and agent graphs, and automatically evaluate responses for quality and safety metrics.
- Experiment Monitoring: Track and compare different prompts, models, and configurations to understand their impact on performance and cost before deploying to production.
Pricing & Implementation
Datadog's pricing is usage-based and adds on to its existing product suite. LLM Observability is priced per million analyzed spans, and costs can scale significantly with high-volume data ingestion. This model is most cost-effective for organizations already committed to the Datadog platform, as it consolidates billing and support. New users may find the initial setup and cost structure complex compared to standalone ML monitoring tools.
- Website: https://www.datadoghq.com
7. New Relic AI Monitoring
New Relic extends its renowned application performance monitoring (APM) capabilities into the AI space, positioning itself as a powerful, integrated solution for teams already embedded in its ecosystem. Instead of a standalone product, New Relic AI Monitoring (AIM) is a feature set within the New Relic One platform. This makes it one of the most compelling machine learning model monitoring tools for organizations that want to correlate model performance directly with application health, user experience, and infrastructure stability. This holistic view is critical for user-facing AI features, where a poor experience could be caused by model latency, a backend API failure, or a frontend JavaScript error.
The platform's primary advantage is its auto-instrumentation via existing New Relic agents, which simplifies the collection of vital AI telemetry. By leveraging OpenTelemetry through its OpenLIT support, it captures LLM-specific data like token usage, response quality, and latency. This approach allows engineering teams to view AI metrics alongside traditional APM "golden signals" (latency, traffic, errors, saturation), providing a holistic view of how an AI feature impacts the entire tech stack. This reduces the time to resolution for complex, multi-system problems.
Key Features & Use Cases
- Full-Stack Observability: Connect AI model performance directly to application and infrastructure metrics, ideal for debugging user-facing AI features where latency or errors could stem from either the model or the underlying service.
- Auto-Instrumentation: For applications already using New Relic agents, enabling AI monitoring is straightforward, significantly reducing the setup overhead for LLM applications built on frameworks like OpenAI, Bedrock, and LangChain.
- Unified Dashboards: Visualize token counts, response traces, and quality metrics within the same platform used for database monitoring and Kubernetes health, streamlining the DevOps and MLOps workflow.
Pricing & Implementation
New Relic's pricing is user-based and data-ingestion-based, with AIM included as part of its broader platform plans (Standard, Pro, Enterprise). There isn't a separate price for AI monitoring; instead, the data generated by your AI applications contributes to your overall data ingest limits. While this simplifies billing for existing customers, it can be a significant investment if you only need AI monitoring. Implementation is agent-based, making it one of the more seamless options for existing users compared to a standalone tool, and it complements other application performance monitoring tools effectively.
- Website: https://newrelic.com
8. Amazon SageMaker Model Monitor
For teams deeply embedded in the AWS ecosystem, Amazon SageMaker Model Monitor is one of the most natural choices for machine learning model monitoring tools. Its primary advantage is the seamless, native integration with the broader SageMaker suite, automating the process of monitoring data quality, model performance, feature drift, and bias for models deployed on SageMaker endpoints or running as batch inference jobs. It acts as an operational backbone for MLOps within AWS. This tight integration means less time spent on plumbing and more time on analyzing results, as data capture, job execution, and alerting are all handled within the same managed environment.
The service works by capturing inference data, comparing it against a baseline generated during training, and executing analysis jobs to detect deviations. It comes with a set of built-in rules for common monitoring tasks but also allows users to bring their own custom analysis scripts using a containerized approach. This makes it flexible enough for standard use cases while accommodating domain-specific monitoring logic. For instance, an e-commerce company could write a custom monitor to track drift in product category distributions. All alerts and reports are integrated directly with Amazon CloudWatch and SageMaker Studio.
Key Features & Use Cases
- Integrated Monitoring: Automatically monitor data quality, model quality (using ground truth labels), feature attribution drift, and model bias for SageMaker models.
- Scheduled & Ad-Hoc Jobs: Configure continuous monitoring schedules for live endpoints or run one-time analysis jobs for batch transform tasks or for troubleshooting.
- AWS Ecosystem Integration: Leverages SageMaker Processing jobs for analysis, stores reports in S3, and triggers alerts via CloudWatch for a fully native AWS experience.
Pricing & Implementation
SageMaker Model Monitor's pricing is tied to the underlying AWS services it consumes. Users pay for the SageMaker Processing instance hours used to run the monitoring jobs, the S3 storage for captured data and reports, and any associated CloudWatch metrics and alarms. This usage-based model can be cost-effective but introduces pricing complexity. Implementation requires setting up data capture configurations on endpoints and defining monitoring schedules, which may involve a learning curve for teams new to the SageMaker environment.
9. Google Cloud Vertex AI – Model Monitoring
For teams already invested in the Google Cloud ecosystem, Vertex AI Model Monitoring offers a native and deeply integrated solution. It stands out as one of the most convenient machine learning model monitoring tools for users who deploy models on Vertex AI Endpoints. The service is designed to automatically detect training-serving skew and prediction drift by comparing production traffic against a baseline dataset, such as the original training data. This automation saves significant engineering effort that would otherwise be spent building custom monitoring pipelines.
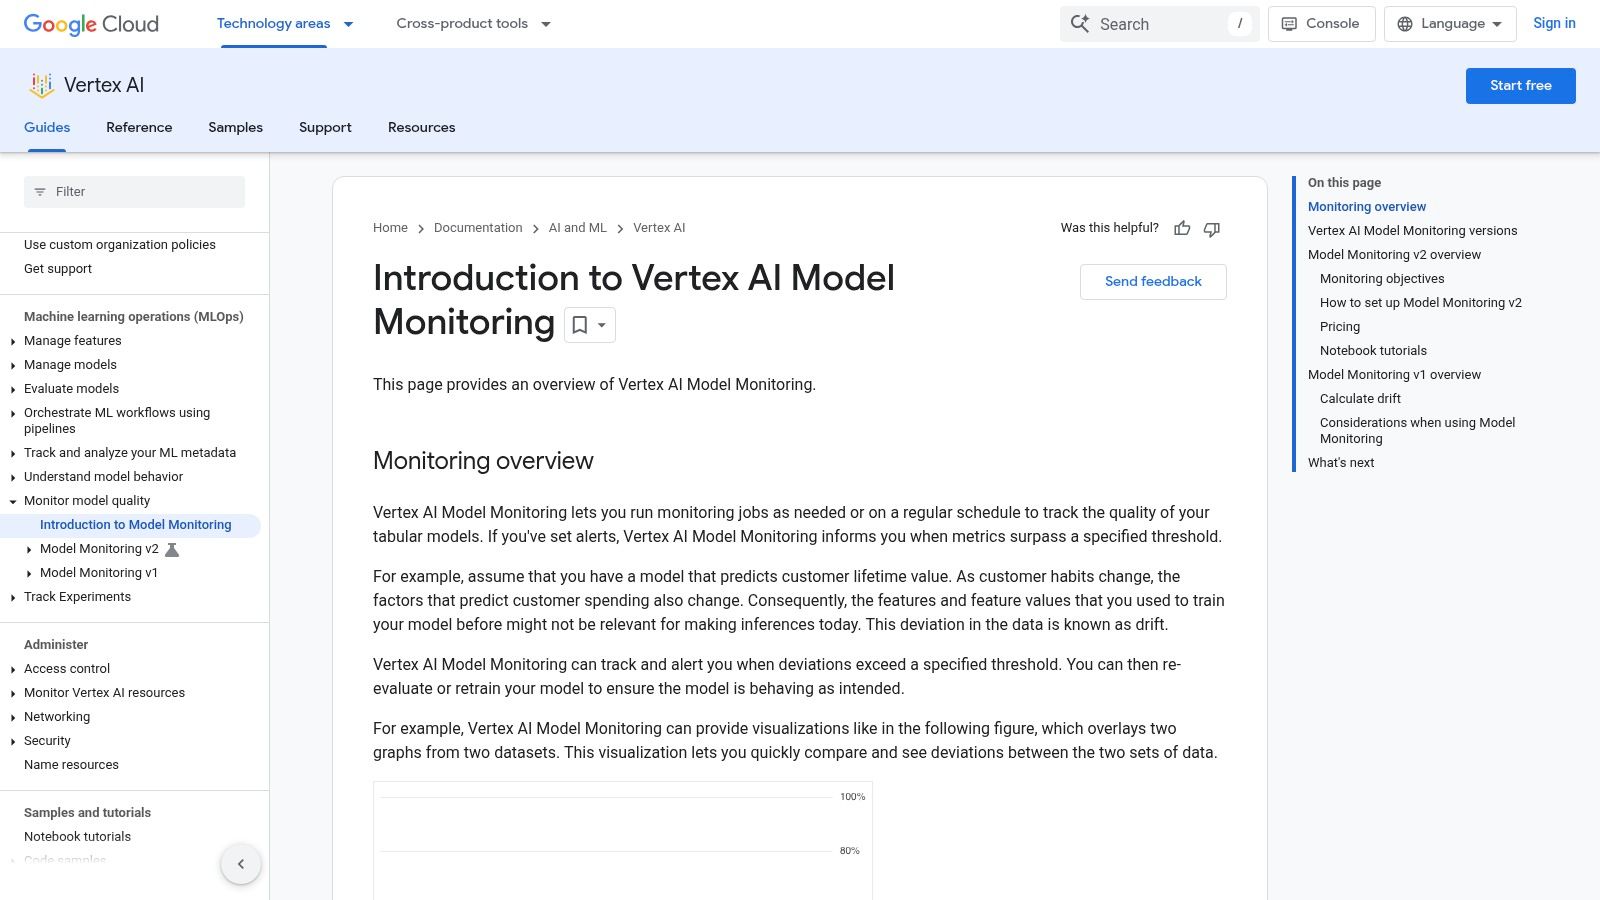
Its primary strength is its seamless connection to other GCP services like BigQuery, Cloud Storage, and Cloud Monitoring. This allows for straightforward configuration where data sources and alerting mechanisms are already within the same environment. For example, you can schedule monitoring jobs to analyze prediction logs stored in BigQuery and automatically trigger a Cloud Alert if a feature's distribution drifts beyond a specified threshold. While its v2 monitoring capabilities are particularly robust for tabular models, it also provides pre-built observability dashboards for managed Generative AI models, making it a versatile choice for teams operating exclusively on Google Cloud.
Key Features & Use Cases
- Integrated Skew & Drift Detection: Automatically compares incoming prediction data with a training baseline to identify feature-level drift and skew.
- GCP Native Alerting: Set configurable thresholds for drift and receive alerts directly through Google Cloud's monitoring and alerting infrastructure.
- Unified Model Registry: Register different model versions and apply specific monitoring jobs to each, enabling clear version-to-version performance tracking. For teams preparing models for deployment, a production readiness checklist can ensure all monitoring aspects are covered.
Pricing & Implementation
Vertex AI Model Monitoring is priced based on the volume of data analyzed, specifically the number of prediction requests processed per month. It offers a generous free tier, making it accessible for initial experimentation. As a native GCP service, implementation is straightforward for models deployed within Vertex AI, often requiring just a few configurations in the Cloud Console or via the SDK. However, while it can monitor external models, the richest features and simplest setup are reserved for models managed by Vertex AI.
10. Microsoft Azure AI Foundry Observability
For teams deeply embedded in the Microsoft ecosystem, Azure AI Foundry Observability offers a native solution for monitoring models and AI applications built on Azure. It is not a standalone product but rather a set of capabilities built on top of the robust Azure Monitor service. This makes it one of the most integrated machine learning model monitoring tools for organizations prioritizing Azure's governance, security, and identity management features. By leveraging existing infrastructure, teams can maintain a consistent operational posture across all their cloud resources, including their AI workloads.
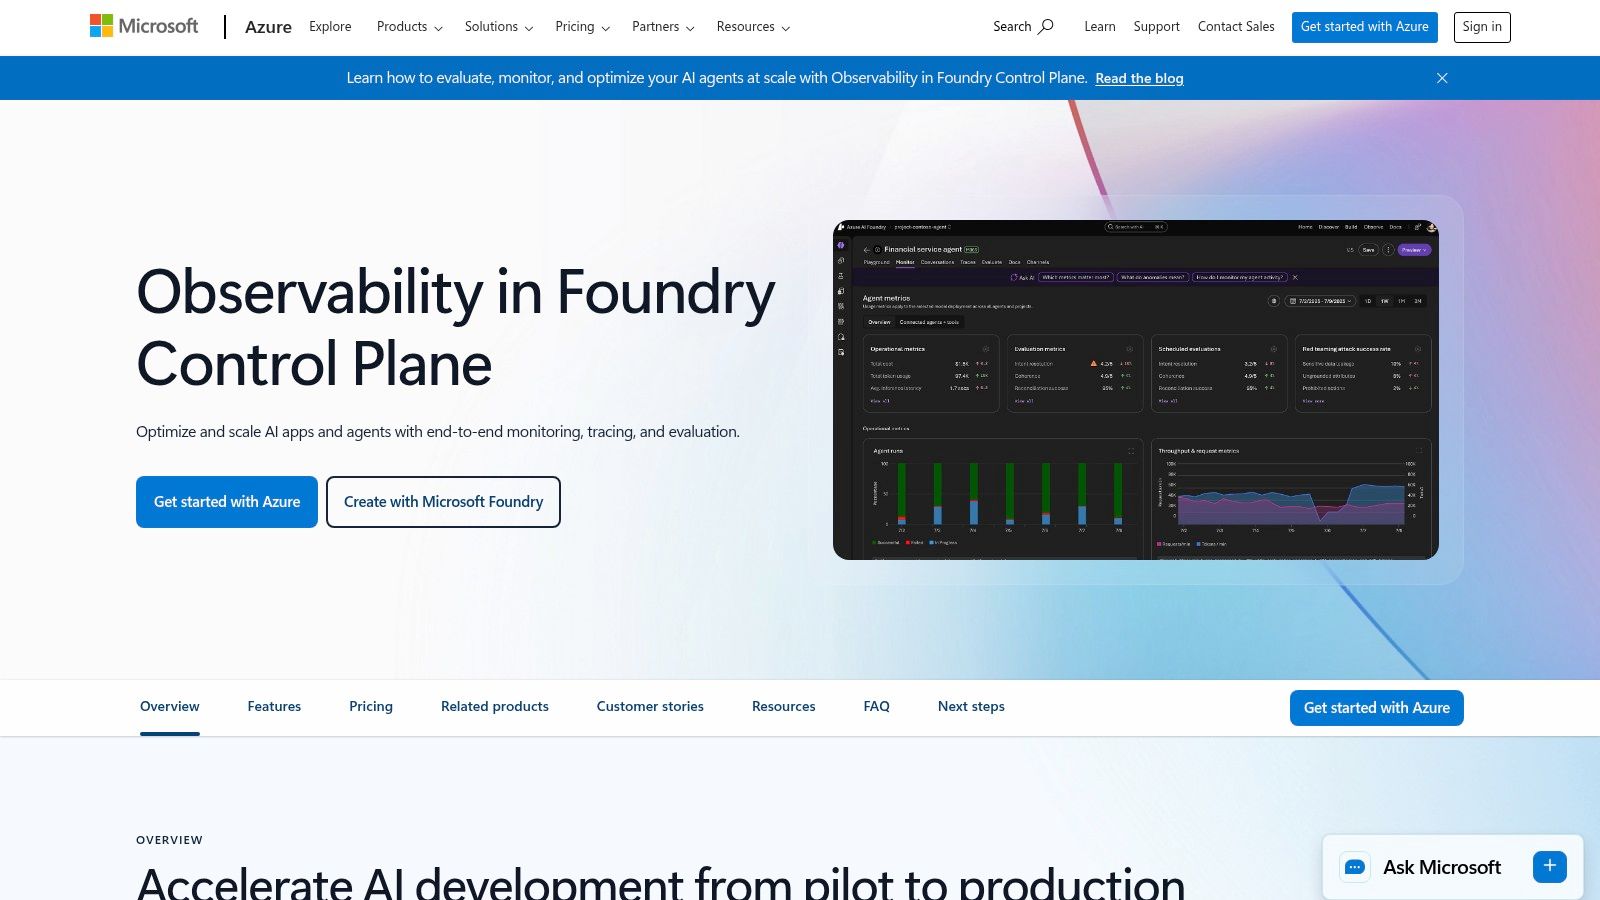
Its core advantage is its seamless connection to other Azure services. If you deploy models via Azure Machine Learning or build applications with Prompt Flow, this tool provides a unified dashboard to track operational metrics like latency, requests, and errors. The integration with Azure Monitor allows for the creation of sophisticated alerts and automated actions, leveraging a familiar interface for existing Azure users. This enables powerful workflows, such as automatically triggering a retraining pipeline via an Azure Function when model performance degrades below a certain threshold.
Key Features & Use Cases
- Native Azure Integration: Unifies monitoring within the Azure portal, inheriting Role-Based Access Control (RBAC), security policies, and billing from the existing subscription.
- Prompt Flow Quality Metrics: Specifically designed to evaluate generative AI applications built in Azure, tracking metrics like groundedness, coherence, and relevance.
- Operational Health Monitoring: Provides live infrastructure and endpoint metrics for models deployed on Azure, including Azure OpenAI, enabling quick diagnosis of performance issues.
Pricing & Implementation
There is no direct pricing for AI Foundry Observability itself; costs are incurred through the underlying Azure services it utilizes, primarily Azure Monitor. This pay-as-you-go model depends on data ingestion, retention, and the number of metrics and alerts configured. Implementation involves enabling monitoring on your Azure AI resources, which automatically starts routing logs and metrics to Azure Monitor. A key consideration is that many features are still in preview, so production readiness and availability may vary across regions and services, requiring careful validation before enterprise-wide deployment.
11. Langfuse
Langfuse is a fully open-source observability and analytics platform specifically designed for LLM applications, making it one of the most developer-friendly machine learning model monitoring tools in the generative AI space. Its core value proposition is providing granular tracing, evaluation, and prompt management in a single, self-hostable package. This open-source nature (MIT license) gives teams complete control over their data and infrastructure, a critical factor for organizations with strict security or compliance requirements. It empowers developers to own their observability stack end-to-end.
The platform focuses heavily on the development and iteration lifecycle of LLM-powered features. It enables engineers to visualize complex agentic chains, track token usage and costs, and create evaluation datasets to score model performance against predefined metrics. By integrating prompt management directly into the observability workflow, teams can version, test, and deploy new prompts with a clear understanding of their impact on quality and cost. For example, a developer can A/B test two different prompts in production, and Langfuse will provide analytics on which one leads to better user feedback or lower costs.
Key Features & Use Cases
- LLM Tracing & Debugging: Provides detailed traces of prompts, completions, and tool calls to help developers debug complex multi-step chains and RAG systems.
- Evaluation & Analytics: Allows teams to build datasets for quality assurance, create annotation queues for human feedback, and analyze performance metrics over time.
- Prompt Management: A centralized hub to manage, version, and collaborate on prompts, linking them directly to production performance data for rapid iteration.
Pricing & Implementation
Langfuse offers a compelling dual model: a completely Free self-hosted option and a managed Cloud service with its own generous free tier. Paid cloud plans scale with usage and unlock features like SSO and dedicated support. Implementation requires instrumenting code with their Python or JS/TS SDKs, which are OpenTelemetry-friendly. While the self-hosted path is a major advantage, it requires infrastructure management, whereas enterprise features are reserved for higher-tier cloud or enterprise plans.
- Website: https://langfuse.com
12. G2 (Model Monitoring/LLMOps category)
While not a monitoring tool itself, G2's Model Monitoring and MLOps Platforms categories serve as an essential research hub. It acts as a buyer's marketplace, aggregating verified user reviews, satisfaction scores, and detailed vendor profiles to help teams compare the landscape of machine learning model monitoring tools. Its value lies in providing social proof and real-world feedback, which is crucial for shortlisting vendors before committing to a demo or trial. This peer-driven insight helps cut through marketing hype and provides a more realistic picture of a tool's capabilities and limitations.
The platform allows users to filter and compare tools based on specific features, business size, and user ratings. This helps teams move beyond marketing claims and understand how a tool actually performs in a production environment according to its user base. For teams evaluating multiple options, G2 provides a structured way to gauge market reputation, ease of use, and quality of support, directly from practitioners. For instance, a startup might filter for tools with high "Ease of Setup" scores, while an enterprise might prioritize vendors with a strong "Market Presence" and positive reviews for enterprise-level support.
Key Features & Use Cases
- Verified User Reviews: Access unbiased pros and cons from real users to understand the practical strengths and weaknesses of each platform.
- Comparative Analysis: Use G2 Grid reports to visually compare vendors based on market presence and customer satisfaction scores, helping to identify market leaders and niche innovators.
- Vendor Shortlisting: An ideal starting point for teams in the discovery phase, allowing them to create a data-backed list of potential tools to investigate further.
Pricing & Implementation
G2 is free to use for research and comparison purposes. However, pricing and implementation details for the listed tools are not directly available on the platform. Users must click through to the official vendor websites for that information. A key consideration is that some listings cover broader MLOps platforms where model monitoring is just one feature, so its depth may vary.
Top 12 Model Monitoring Tools: Feature Comparison
| Product | Core features ✨ | Unique selling points 🏆 | Target audience 👥 | UX/Quality ★ | Pricing/Value 💰 |
|---|---|---|---|---|---|
| Arize AI | Production ML/LLM monitoring, tracing, token & cost tracking, online/offline evals | Unified LLM + traditional ML stack; open-source Phoenix option | Teams needing unified ML/LLM observability | ★★★★☆ (robust observability) | 💰 Free → Pro/Enterprise; high-volume can be costly |
| Fiddler AI | Drift/performance monitoring, explainability, LLM trust (hallucination/toxicity), RBAC/on‑prem | Deep explainability & governance; on‑prem for regulated orgs | Regulated enterprises, compliance teams | ★★★★☆ (feature‑rich, steeper learning) | 💰 Enterprise-focused; pricing opaque / sales-led |
| Evidently AI | OSS library + managed cloud, 100+ metrics, test suites, dashboards & alerting | Strong open-source foundation; easy to start free | Devs & data teams wanting OSS-first monitoring | ★★★★☆ (developer-friendly; integration needed) | 💰 Free self-host; transparent cloud tiers for paid features |
| Deepchecks | Data/model checks, drift monitors, dashboards, alerts; AGPL self‑host or managed cloud | Clear, granular pricing and good docs/demos | Hands-on MLOps teams and practitioners | ★★★★☆ (good docs; OSS path) | 💰 Clear tiers; scaling requires paid plans |
| Superwise | Runtime guardrails, policy enforcement, real-time threat/policy monitoring | Fast free pilot; enterprise isolation & SSO | Governance teams, pilot projects, security-first orgs | ★★★★☆ (governance-centric UX) | 💰 Free starter → Enterprise; API caps on low tiers |
| Datadog LLM Observability | Prompt/response tracing, quality & safety evals, correlate AI with infra/APM | One console for infra, logs, APM and AI signals | Enterprises using Datadog platform | ★★★★☆ (enterprise-grade, integrated) | 💰 Enterprise pricing; costs scale with ingestion |
| New Relic AI Monitoring | Auto-instrumentation, full‑stack AI metrics, integrations (OpenAI, LangChain) | Quick enablement for New Relic customers; APM correlation | Existing New Relic customers & full‑stack teams | ★★★★☆ (integrated; agent-dependent) | 💰 Bundled with New Relic plans; AI line-item varies |
| Amazon SageMaker Model Monitor | Continuous/on‑demand endpoint & batch monitoring, built‑in rules, CloudWatch integration | Deep AWS/SageMaker integration and operations tooling | AWS/SageMaker-centric ML teams | ★★★★☆ (stable, ops‑minded) | 💰 Charges via SageMaker/CloudWatch; pricing complexity |
| Google Cloud Vertex AI – Model Monitoring | Skew/drift detection, model registry, alerts, dashboards for GenAI & tabular | Tight GCP data-store & Cloud Monitoring integration | GCP teams and Vertex users | ★★★★☆ (good for managed models) | 💰 GCP billing model; varies by usage & model type |
| Microsoft Azure AI Foundry Observability | Live metrics, prompt flow quality, unified dashboards & governance | Native Azure RBAC/security; Azure Monitor integration | Azure customers using Prompt Flow / OpenAI | ★★★☆☆ (some features in preview; maturing) | 💰 Billed via Azure Monitor & services; preview constraints |
| Langfuse | Prompt/output tracing, evaluation datasets, annotation queues, prompt/version mgmt | MIT‑licensed OSS self‑host + hosted cloud; LLM-focused tooling | LLM app teams that prefer OSS and rapid iteration | ★★★★☆ (lightweight, dev-friendly) | 💰 Free self-host (MIT); hosted plans for convenience |
| G2 (Monitoring category) | Vendor profiles, user reviews, category filters, comparative pages | Neutral marketplace with verified user feedback for shortlisting | Buyers researching vendors and fit | ★★★★☆ (useful research resource) | 💰 Free to use; vendor pricing found on vendor pages |
Choosing Your Co-Pilot: How to Select the Right Monitoring Tool
We've journeyed through a comprehensive landscape of machine learning model monitoring tools, from open-source champions like Evidently AI to enterprise-grade platforms like Arize and Fiddler. The sheer variety underscores a critical truth: there is no single "best" tool. The right choice is less about finding a silver bullet and more about selecting the perfect co-pilot for your specific mission.
Your ideal monitoring solution hinges on your unique operational context. A solo developer launching an MVP has vastly different needs than a large enterprise managing hundreds of mission-critical models. The former might prioritize the simplicity and cost-effectiveness of an open-source tool like Deepchecks for quick validation, while the latter requires the robust scalability, security, and advanced explainability features offered by a platform like Superwise.
Recapping Your Options and Key Takeaways
Throughout this guide, we've seen how tools specialize. Arize and Fiddler excel in providing deep, granular insights into model performance and root cause analysis, making them invaluable for teams where model accuracy directly impacts revenue. Meanwhile, cloud-native solutions like Amazon SageMaker Model Monitor and Google Vertex AI offer seamless integration for teams already committed to their respective ecosystems, simplifying infrastructure management significantly.
For those navigating the brave new world of Large Language Models, specialized LLMOps tools like Langfuse and the LLM-focused features within Datadog and New Relic are essential. They address unique challenges like prompt engineering, token usage tracking, and hallucination detection that traditional monitoring tools weren't built for. Don't underestimate the power of starting with a solid foundation; even a simple, self-hosted Evidently AI dashboard can prevent catastrophic model failures down the line.
A Practical Framework for Your Decision
Making the right choice requires a clear-eyed assessment of your team's needs, resources, and technical maturity. Before you commit, use this checklist to guide your evaluation:
- Scale and Complexity: How many models are you deploying? Are they simple classifiers or complex, multi-stage pipelines? Your answer will dictate whether a lightweight solution or a heavy-duty platform is more appropriate.
- Team Expertise: Do you have a dedicated MLOps team, or are your data scientists and developers wearing multiple hats? Managed, low-code platforms can accelerate deployment for smaller teams, while more configurable tools offer greater flexibility for experts.
- Budgetary Constraints: Be realistic about your budget. Explore the generous free tiers and open-source options if you're a startup. For larger organizations, calculate the total cost of ownership, including implementation, training, and maintenance, not just the subscription fee.
- Integration Needs: Where does this tool fit into your existing stack? Ensure it integrates smoothly with your cloud provider, CI/CD pipelines, and data sources. Poor integration can create more problems than it solves.
- Core Problem to Solve: Are you primarily concerned with data drift, performance degradation, or model fairness and explainability? Prioritize tools that excel in the areas most critical to your business.
Selecting from the many available machine learning model monitoring tools is a strategic decision that directly impacts your product's reliability and your company's bottom line. The goal isn't just to detect failure; it's to build a resilient, trustworthy AI system. By carefully considering your specific context and using the insights from this guide, you can choose a partner that empowers your team to deploy and maintain models with confidence.
Feeling overwhelmed by the implementation process or need expert help integrating one of these machine learning model monitoring tools into your stack? Vibe Connect connects you with a curated network of on-demand MLOps and DevOps experts ready to tackle your specific challenges, from initial setup to production hardening. Get the specialized talent you need, exactly when you need it, at Vibe Connect.