
In modern software delivery, infrastructure is not just a static set of servers; it is a dynamic, complex ecosystem of containers, microservices, and cloud resources. Standard health checks and simple ping tests are no longer sufficient to guarantee reliability. To prevent costly downtime, optimize application performance, and consistently ship reliable products, you need deep, contextual visibility into every layer of your technology stack. This requires a strategic shift from basic uptime checks to embracing comprehensive observability, a philosophy that allows you to understand the internal state of your systems from their external outputs.
The primary challenge is navigating the crowded and often confusing market of monitoring solutions. With dozens of options, each boasting different strengths, intricate pricing models, and specific target users, how do you choose the right one for your organization? This guide is designed to cut through the noise, providing a detailed, practical breakdown of the best infrastructure monitoring tools available today. We move past the marketing copy to give you an honest, in-depth assessment based on real-world application, from small startups building their first product to large enterprises managing global-scale infrastructure.
This long-form resource is designed to be your definitive guide for making an informed decision. We will meticulously analyze the core strengths, pricing structures, ideal use cases, and crucial limitations of each platform. For every tool, you will find screenshots, direct links, and actionable insights to help you match its capabilities to your specific technical needs and business goals. Whether you are an indie hacker building an MVP, a tech lead at a mid-sized company scaling your services, or an AI team hardening a production environment, this list will help you find the perfect fit to gain control over your systems. We dive deep into each option to ensure you can make a well-informed decision that supports your operational excellence for years to come.
1. Datadog
Datadog is a comprehensive SaaS-based observability platform that consolidates infrastructure monitoring, application performance monitoring (APM), log management, and security into a single, unified interface. It's renowned for its fast time-to-value, making it one of the best infrastructure monitoring tools for teams that need to get up and running quickly without extensive configuration. The platform excels at providing deep visibility into complex, modern environments, especially those involving containers and microservices, where traditional monitoring tools often fall short.
Its agent automatically discovers services running on hosts or within Kubernetes clusters, immediately populating pre-built dashboards with relevant metrics. This auto-discovery feature is a significant advantage, reducing the manual effort required to monitor dynamic systems. With over 600 integrations, Datadog connects seamlessly with nearly every technology in the modern stack, from cloud providers like AWS and Azure to databases like PostgreSQL and messaging queues like RabbitMQ. This extensive integration library ensures you can get a holistic view without custom engineering work.
Key Features & Use Cases
- Ideal Use Case: Teams operating hybrid-cloud or containerized environments (especially Kubernetes) who need a unified view of metrics, traces, and logs. It's also excellent for organizations aiming to consolidate multiple disparate monitoring tools into one platform to reduce tool sprawl and operational complexity.
- Unified Observability: Correlate infrastructure metrics with application traces and logs without switching contexts. For example, you can jump from a CPU spike on a host directly to the specific application logs or traces that occurred at that exact moment, drastically reducing troubleshooting time.
- AI-Powered Insights: The "Watchdog" feature automatically surfaces performance anomalies and potential root causes, helping teams detect issues they weren't actively looking for. This proactive capability is crucial for identifying unknown unknowns in complex systems.
- Cost Management: Offers granular pricing controls. You can pay per-host or per-container and manage costs for custom metrics, which is crucial for controlling spend as you scale your infrastructure and data ingestion volumes.
Our Take: Datadog’s greatest strength is its ability to reduce friction between different data types. By unifying metrics, logs, and traces, it empowers developers and SREs to troubleshoot faster and more effectively, a critical step covered in any robust production readiness checklist. The platform's ease of use and rapid setup make it a top contender for teams prioritizing speed and efficiency.
| Feature | Details |
|---|---|
| Deployment Model | SaaS (Software as a Service) |
| Core Focus | Unified observability (Metrics, Traces, Logs, Security) |
| Pricing | Per-host, per-container, GB ingested for logs. Free tier available. |
| Primary Advantage | Ease of use and extensive integration marketplace |
| Main Limitation | Costs can escalate with high-cardinality metrics or extensive log ingestion |
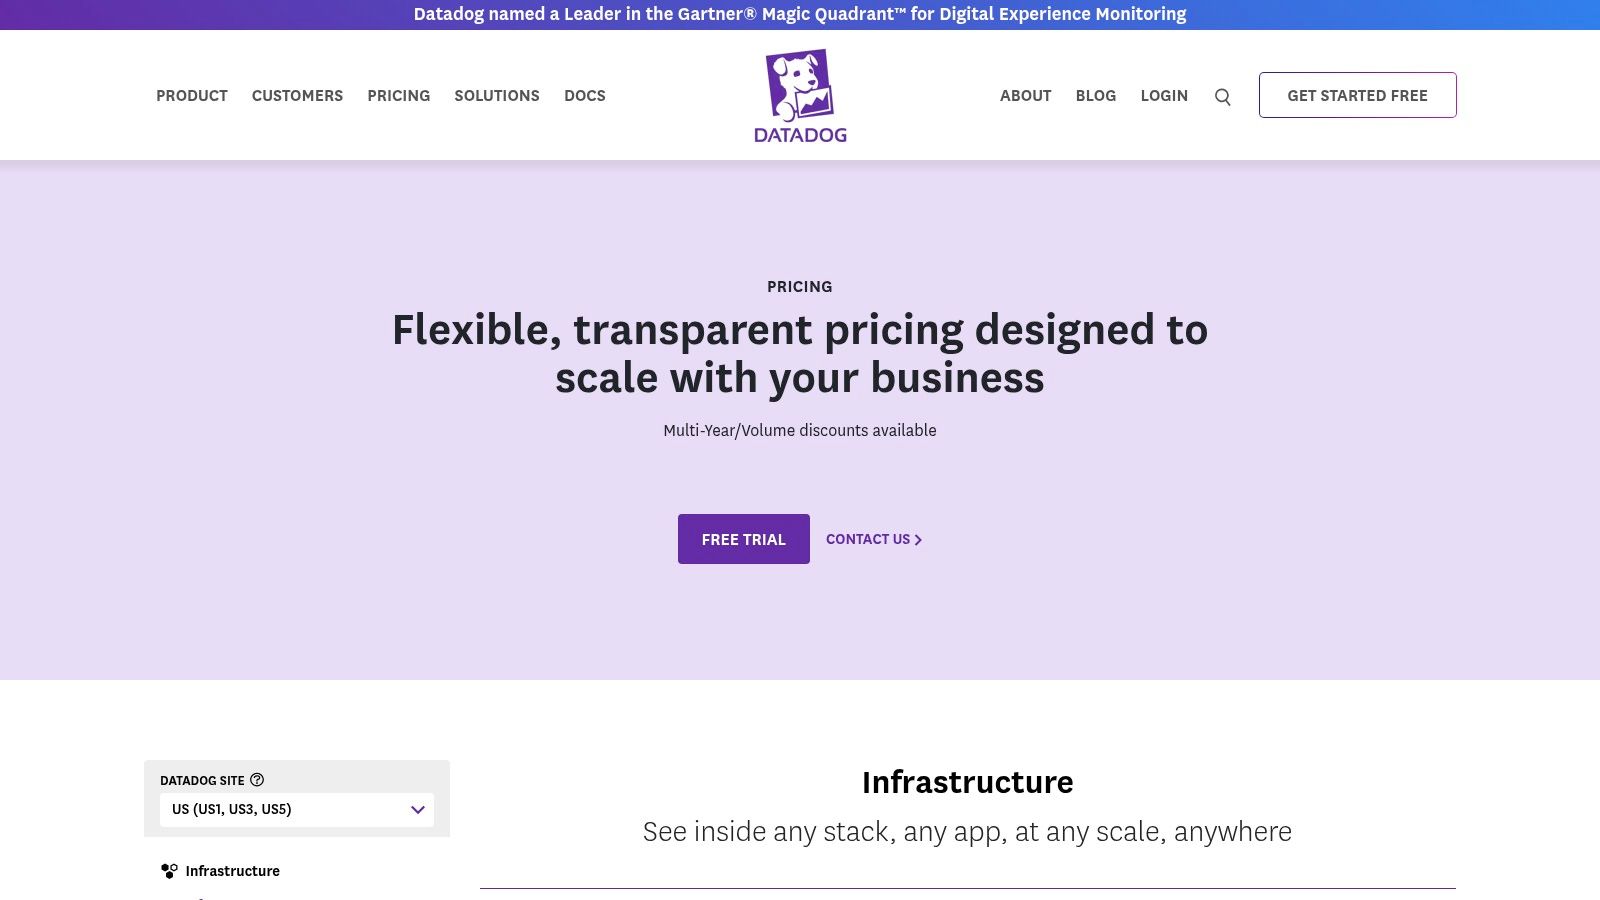
Website: https://www.datadoghq.com/pricing/
2. New Relic
New Relic positions itself as an all-in-one observability platform designed to simplify the complex world of infrastructure monitoring. It consolidates over 50 capabilities, including APM, log management, and synthetics, into a single user interface. A major draw is its usage-based pricing model, paired with a perpetual free tier that includes 100 GB of data ingest per month, making it one of the best infrastructure monitoring tools for teams wanting to start without an initial investment and scale costs predictably.
The platform is built to be open and flexible, with a strong emphasis on OpenTelemetry-friendly data ingestion. This allows teams to avoid vendor lock-in and use open standards to send telemetry data from their entire stack. New Relic's focus on organizational governance, including features like SSO and user policies, also makes it a strong contender for businesses that need to manage access and security across multiple teams as they grow. This enterprise-readiness is a key differentiator.
Key Features & Use Cases
- Ideal Use Case: Startups and small to mid-sized teams that need a powerful, full-featured observability platform without upfront costs. Also excellent for enterprises standardizing on OpenTelemetry for data collection to ensure future-proof instrumentation.
- Generous Free Tier: The free plan provides full platform access for one user, 100 GB of data ingest per month, and unlimited querying, allowing teams to monitor production systems meaningfully before committing to a paid plan. This is not a trial; it's a perpetually free offering.
- Simplified Pricing: A single usage-based pricing model covers all capabilities, eliminating the need to purchase and manage multiple SKUs for different products like logs, metrics, or traces. This transparency simplifies budget forecasting.
- Enterprise Governance: Includes robust tools for managing users, accounts, and data access policies at scale, which is critical for maintaining security and control in larger organizations with diverse engineering teams.
Our Take: New Relic’s free tier is a game-changer for early-stage companies. It removes the financial barrier to adopting comprehensive observability, which is a core component of building a reliable system. This approach aligns well with modern development practices, especially for those adopting DevOps for startups to build a scalable foundation from day one.
| Feature | Details |
|---|---|
| Deployment Model | SaaS (Software as a Service) |
| Core Focus | All-in-one observability with a simplified, usage-based pricing model |
| Pricing | Per GB ingested and per user. Perpetual free tier available. |
| Primary Advantage | Extremely generous free tier and OpenTelemetry-native data ingestion |
| Main Limitation | Cost planning is necessary at high data volumes to avoid unexpected expenses |
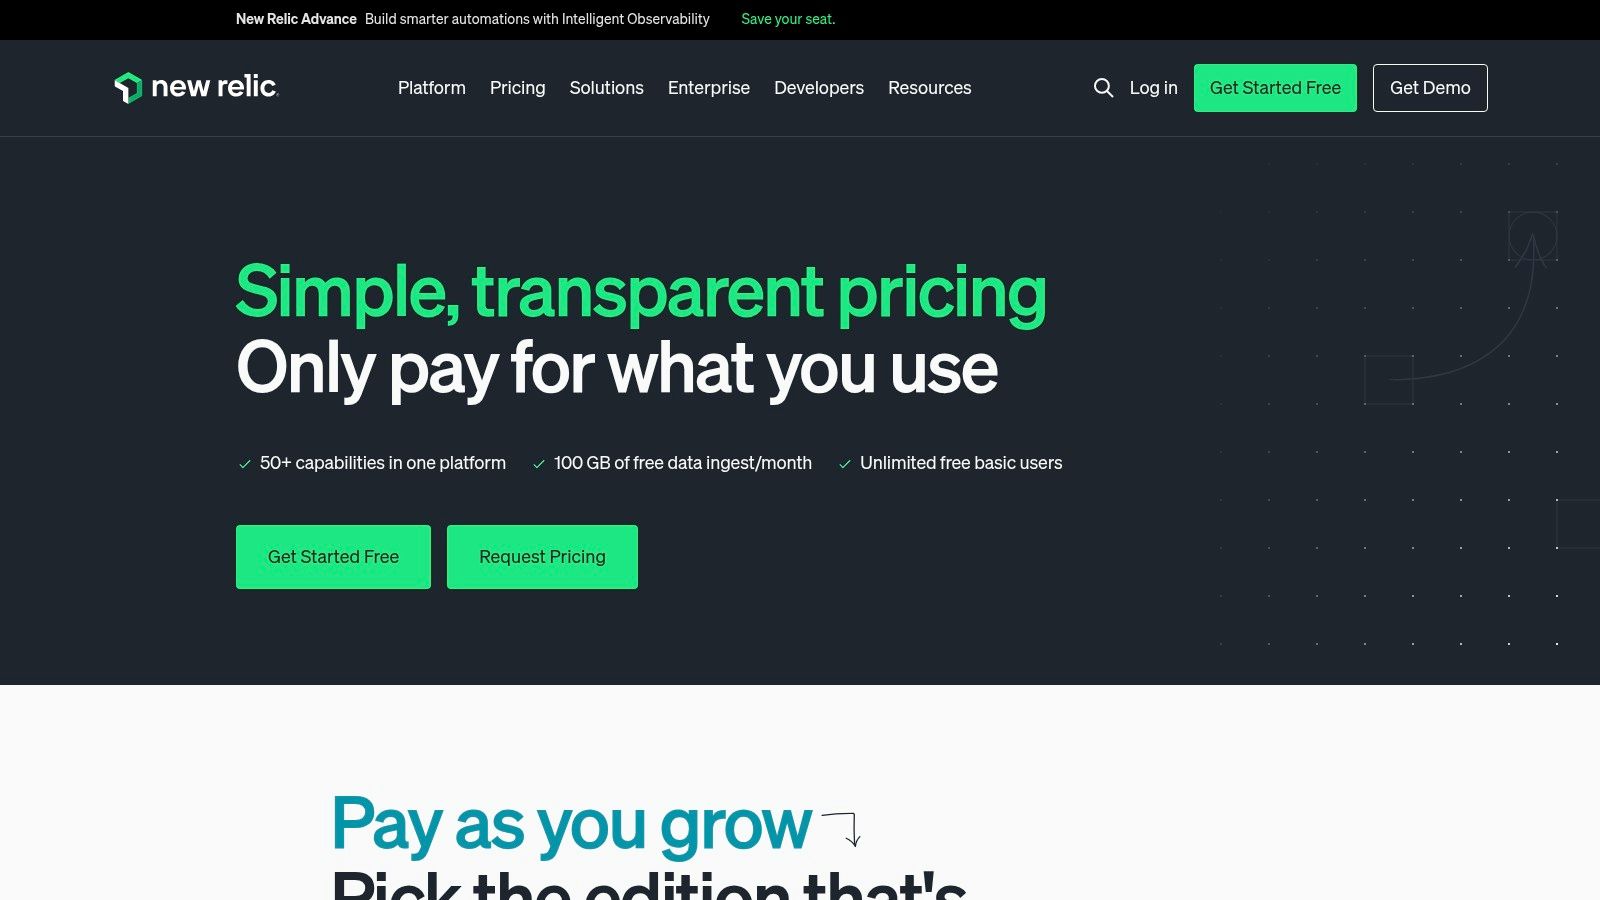
Website: https://newrelic.com/pricing
3. Dynatrace
Dynatrace is an enterprise-grade observability platform focused heavily on automation and AI-powered root-cause analysis. Its core strength lies in the Davis AI engine, which automatically discovers and maps all components of an application stack using its Smartscape topology. This makes it one of the best infrastructure monitoring tools for complex, large-scale environments where manual configuration and analysis are impractical. The platform is designed to provide definitive answers rather than just data, automatically pinpointing the precise source of performance degradations.
This focus on automation extends from discovery to remediation, significantly reducing the mean time to resolution (MTTR). Dynatrace offers a full-stack solution that integrates infrastructure monitoring with logs, real user monitoring (RUM), synthetics, and application security. Its pricing model is also distinct, offering transparent hourly usage rates for hosts and memory, which can provide predictability for organizations with fluctuating workloads once they understand how to map it to their specific needs.
Key Features & Use Cases
- Ideal Use Case: Large enterprises or teams managing highly dynamic, complex application environments who need automated root-cause analysis to reduce operational overhead. It is also well-suited for organizations undergoing a digital transformation and modernizing legacy systems.
- Automatic and Intelligent Observability: The OneAgent automatically instruments hosts, containers, and processes, feeding data into the Davis AI for continuous analysis. Smartscape provides a real-time visualization of all dependencies, which is invaluable for understanding service interactions.
- Full-Stack Context: Seamlessly connects infrastructure health with user experience and business outcomes. It excels in showing how a specific infrastructure problem impacts end-users, a key capability also found in top-tier application performance monitoring tools.
- Predictable Pricing: The transparent, consumption-based pricing (per host-hour, per GiB-hour) allows costs to scale directly with usage, with options for commitment-based discounts, helping avoid surprise bills.
Our Take: Dynatrace’s biggest differentiator is its powerful AI-driven automation. Instead of just presenting dashboards full of charts that require human interpretation, it delivers precise, actionable answers. This makes it invaluable for large teams that need to cut through the noise and solve problems quickly, freeing up valuable engineering time.
| Feature | Details |
|---|---|
| Deployment Model | SaaS and Managed (On-Premises) |
| Core Focus | AI-powered, automated full-stack observability and root-cause analysis |
| Pricing | Consumption-based (per host-hour, GiB-hour). Full-stack and infrastructure-only SKUs available. |
| Primary Advantage | Deep automation and precise, AI-driven causal analysis |
| Main Limitation | Can feel overly complex for smaller teams; the pricing model requires careful planning to forecast costs. |
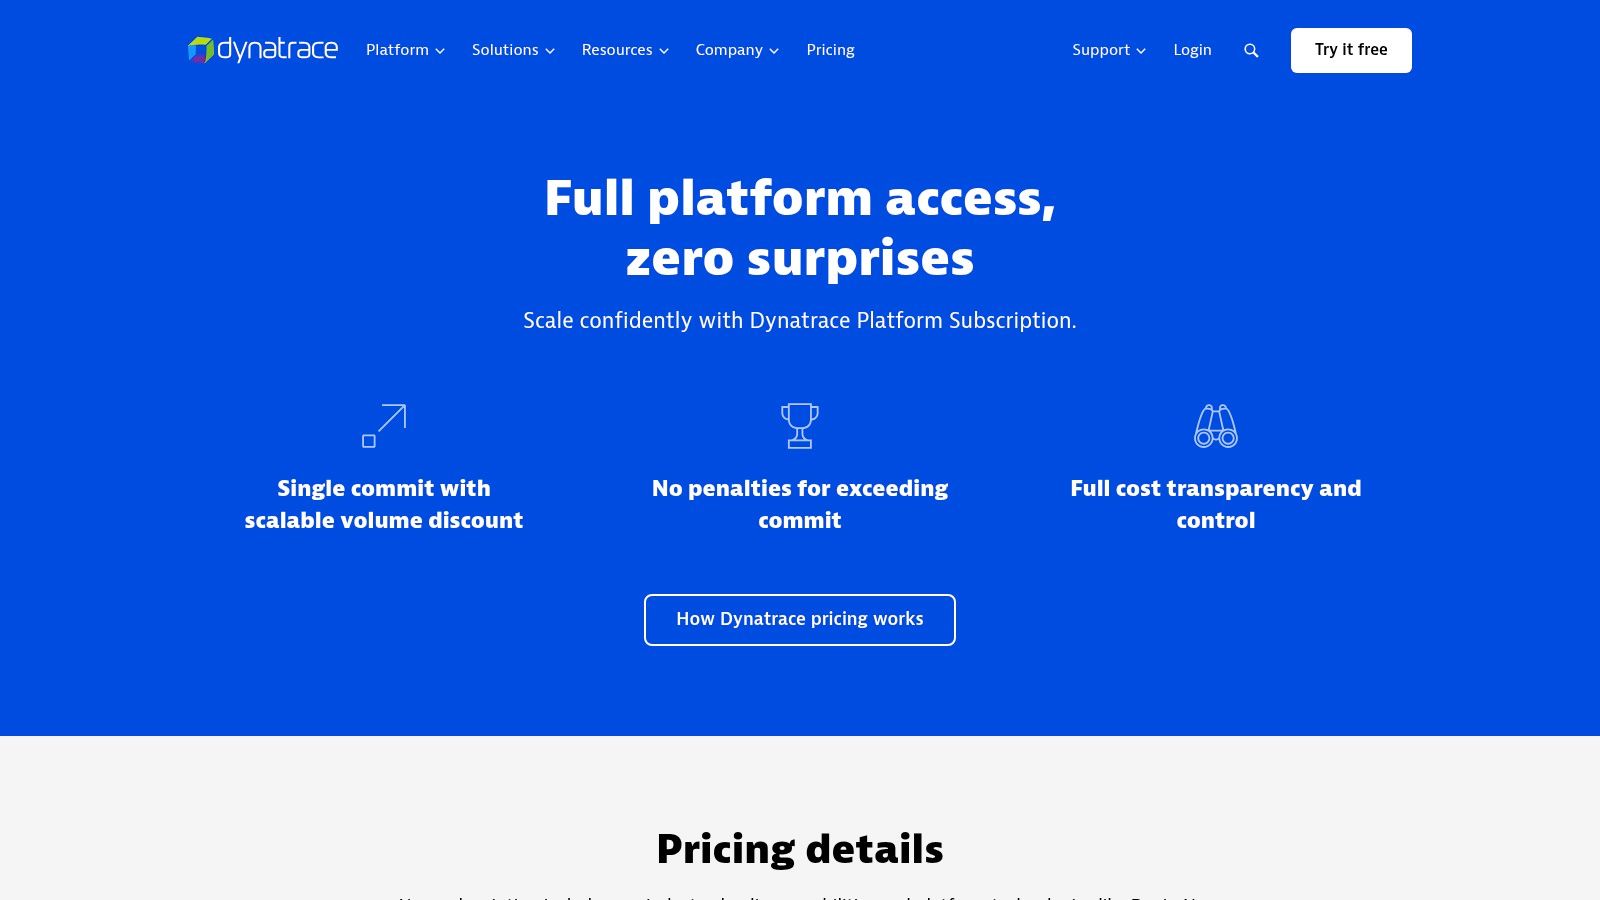
Website: https://www.dynatrace.com/pricing/
4. Grafana Cloud
Grafana Cloud is a fully managed, composable observability platform built around the popular open-source Grafana visualization tool. It bundles managed backends for Prometheus (metrics), Loki (logs), and Tempo (traces), making it one of the best infrastructure monitoring tools for teams committed to open standards. By offering a hosted version of this beloved open-source stack, it eliminates the operational burden of managing storage, scalability, and availability for time-series data, which can be a significant engineering challenge.
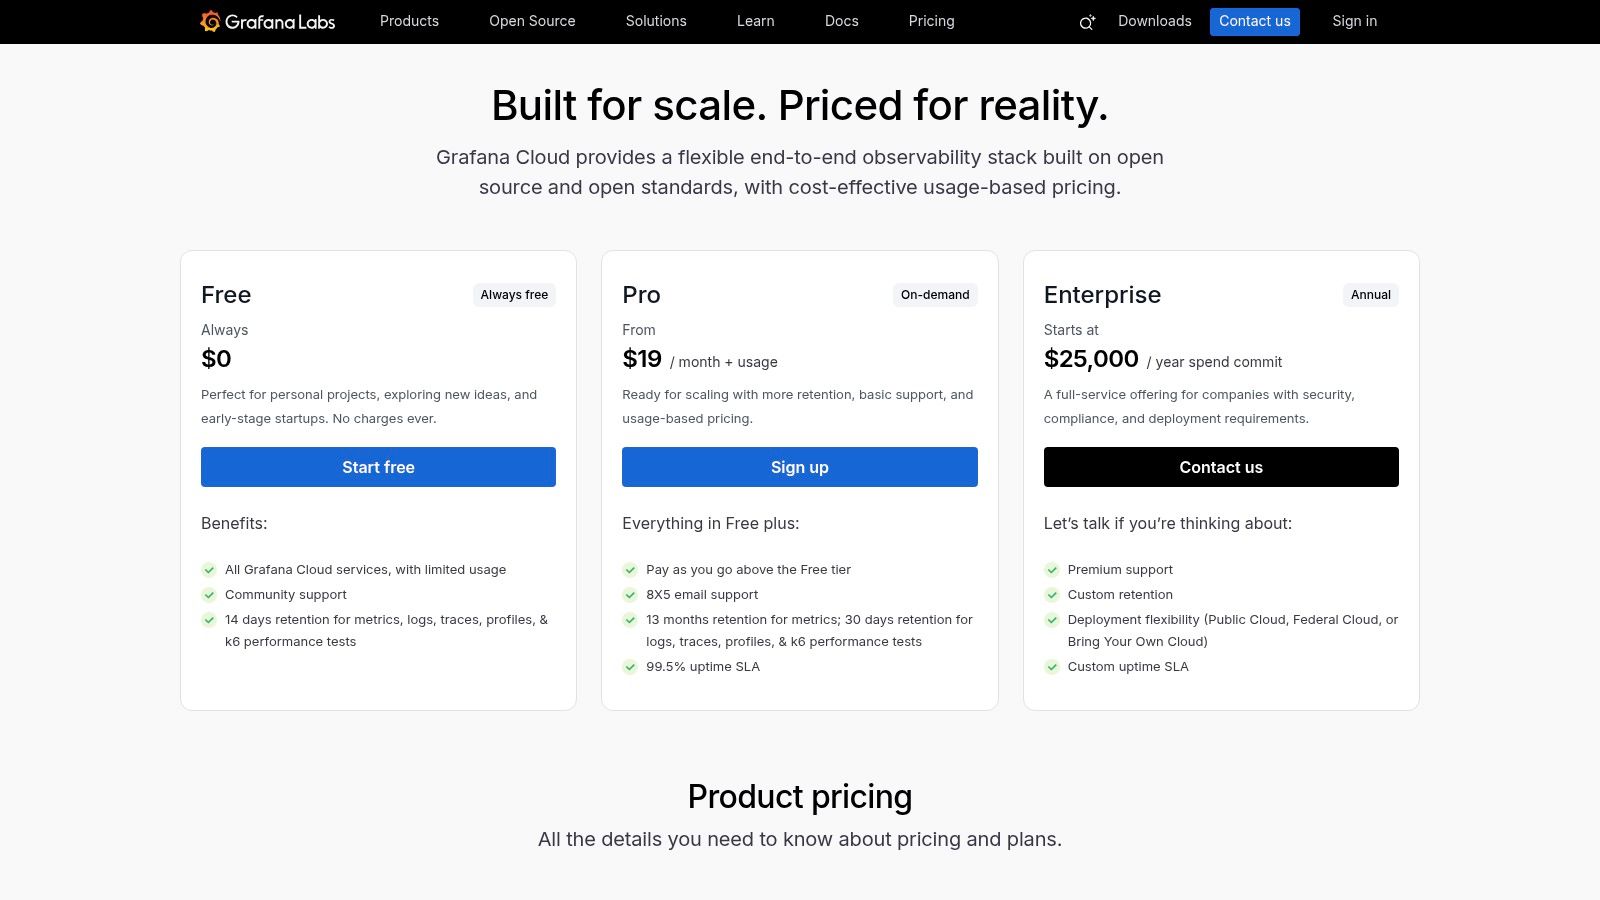
The platform is particularly appealing to organizations already using or wanting to adopt tools like Prometheus without taking on the complexity of running it at scale. Its generous always-free tier provides a powerful starting point for startups and individual developers, while its on-demand pricing ensures costs scale predictably. With native OpenTelemetry support, it's well-positioned for modern cloud-native application observability and avoids vendor lock-in.
Key Features & Use Cases
- Ideal Use Case: Teams that want the power and flexibility of the Prometheus and Grafana ecosystem without the operational overhead. It's perfect for startups, SMBs, and enterprises that value open-source tooling and transparent, usage-based pricing.
- Managed Open-Source Stack: Provides managed, highly-available instances of Prometheus for metrics, Loki for logs, and Tempo for traces, all integrated into the Grafana interface. This offers the best of both worlds: open standards with enterprise-grade reliability.
- Generous Free Tier: The "Always Free" plan includes 10,000 active series for Prometheus metrics, 50 GB of logs, and 50 GB of traces, making it incredibly accessible for small projects or extensive trials before any financial commitment.
- Composable and Flexible: You can use the entire Grafana Cloud stack or choose only the components you need. For instance, you can send metrics to its managed Prometheus service while keeping your logging solution separate, allowing for a gradual adoption strategy.
Our Take: Grafana Cloud's strength lies in its commitment to the open-source community. It offers a seamless, scalable migration path for teams whose self-hosted Prometheus instances are becoming difficult to manage, providing enterprise-grade reliability without vendor lock-in. It's the pragmatic choice for lovers of open source.
| Feature | Details |
|---|---|
| Deployment Model | SaaS (Fully managed) |
| Core Focus | Managed observability based on open-source standards (Prometheus, Loki, Tempo) |
| Pricing | Generous free tier; usage-based pricing for metrics, logs, traces, and users. |
| Primary Advantage | Leverages popular open-source tools with transparent pricing and no vendor lock-in. |
| Main Limitation | Pricing can become complex when scaling multiple products (metrics, logs, traces) heavily. |
Website: https://grafana.com/pricing/
5. Splunk Observability Cloud
Splunk Observability Cloud offers an integrated, full-stack monitoring solution designed for complex, high-throughput enterprise environments. Its key differentiator is its commitment to full-fidelity, no-sampling data ingestion, especially for tracing, making it one of the best infrastructure monitoring tools for organizations where every transaction is critical. The platform combines infrastructure monitoring, APM with AlwaysOn profiling, real user monitoring (RUM), and log management into a unified experience, enabling teams to correlate issues across the entire stack.
Unlike traditional per-host pricing models, Splunk utilizes an entity and activity-based approach, which can be more cost-effective for dynamic or serverless architectures. This model provides granular usage controls but requires careful capacity planning to manage costs effectively. With strong enterprise-grade security and compliance features, it is well-suited for regulated industries that need deep insights without sacrificing data integrity or security protocols.
Key Features & Use Cases
- Ideal Use Case: Large enterprises or high-throughput services in regulated industries (like finance or healthcare) that require 100% data fidelity and cannot tolerate sampling. It's also a strong choice for existing Splunk customers looking to extend into observability.
- No-Sample Full-Fidelity Tracing: Captures every single trace, providing complete visibility into application behavior. This is crucial for debugging intermittent or rare issues that sampled data might miss, ensuring nothing falls through the cracks.
- Unified Workflows: Seamlessly pivot between infrastructure metrics, application traces, and logs to get a complete picture of an incident's root cause from a single interface, avoiding the need to stitch together data from multiple systems.
- Flexible Pricing Model: Entity-based pricing offers a predictable cost structure for modern, ephemeral environments, moving away from the constraints of traditional per-host billing that penalizes containerized architectures.
Our Take: Splunk’s strength lies in its no-compromise approach to data collection. For teams troubleshooting high-stakes applications, its full-fidelity tracing provides an unparalleled level of detail, ensuring that the "needle in the haystack" can always be found. This makes it a powerful choice for mission-critical systems.
| Feature | Details |
|---|---|
| Deployment Model | SaaS (Software as a Service) |
| Core Focus | Integrated full-fidelity observability (Metrics, Traces, Logs, RUM) |
| Pricing | Entity/activity-based; pricing details often require sales consultation. |
| Primary Advantage | Full-fidelity, no-sample tracing for high-throughput services |
| Main Limitation | Complex pricing and capacity planning can be a challenge for new users |
Website: https://www.splunk.com/en_us/products/pricing.html
6. Elastic Observability
Elastic Observability leverages the power of the Elastic Stack (ELK Stack) to provide a unified solution for logs, metrics, and APM traces. Built on the search and analytics capabilities of Elasticsearch, it excels at high-volume, high-cardinality data analysis, making it one of the best infrastructure monitoring tools for teams that prioritize log-centric troubleshooting and flexible data exploration. The platform is designed for organizations that need to ingest, retain, and analyze massive datasets from diverse sources without compromising on query performance.
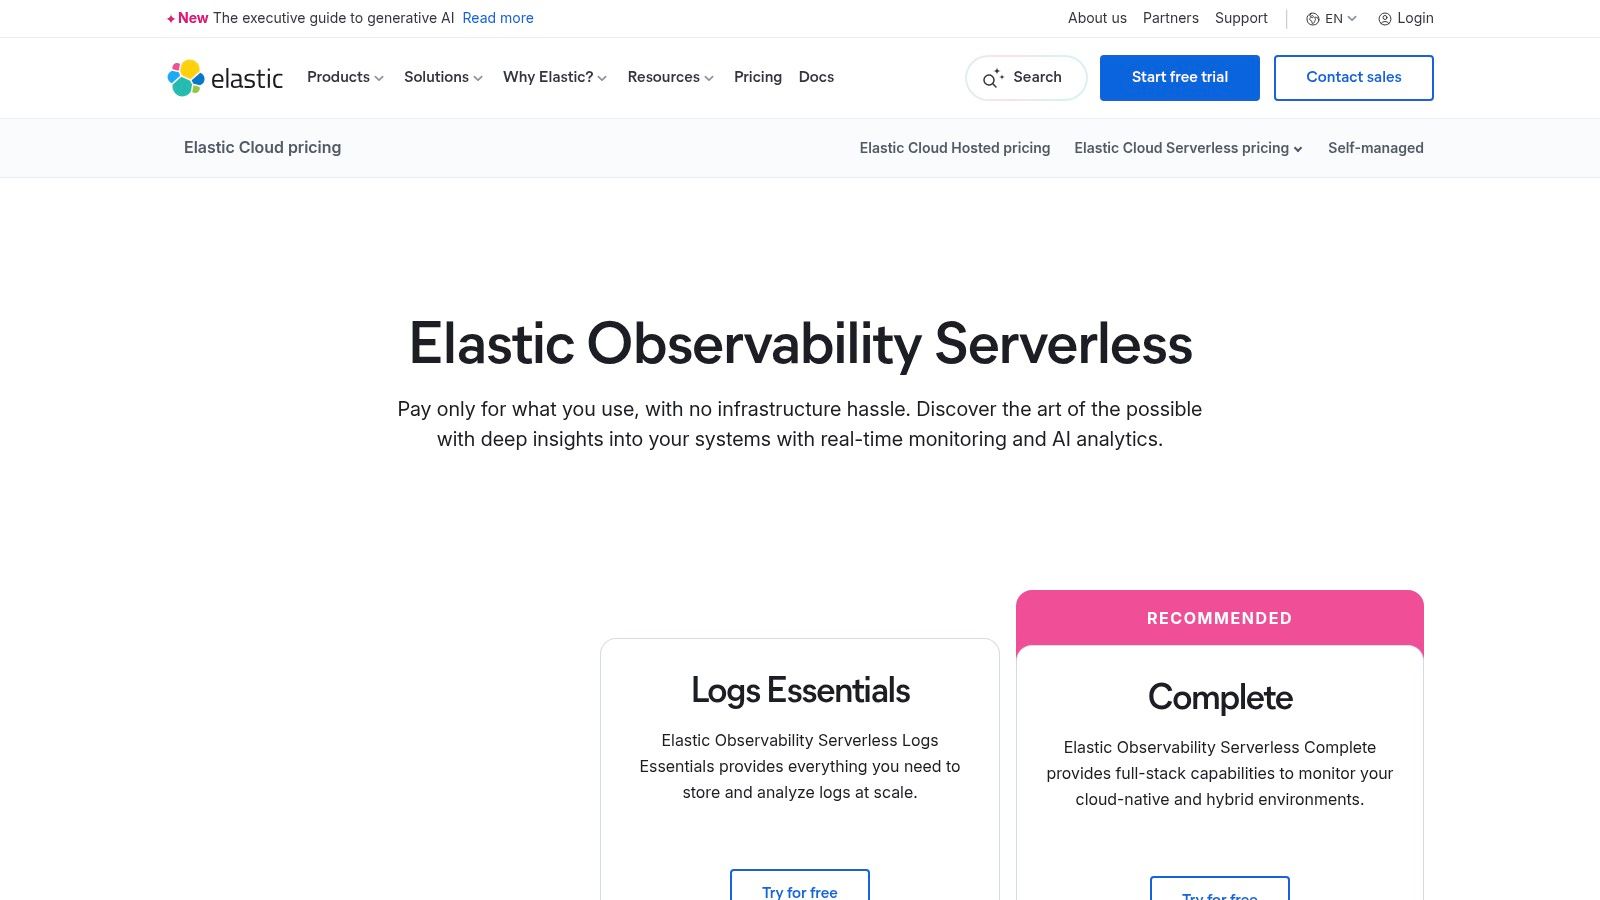
Its OpenTelemetry-first approach and over 350 integrations ensure comprehensive data collection across modern cloud-native environments. Elastic’s strength lies in its ability to let engineers freely slice, dice, and query raw data without pre-aggregation, enabling deep, investigative root cause analysis. The ingest-based pricing model on Elastic Cloud (including Serverless options) gives teams direct control over costs by managing data ingestion and retention policies.
Key Features & Use Cases
- Ideal Use Case: Organizations with log-heavy environments that require powerful, ad-hoc query capabilities. It's a strong fit for teams already familiar with the ELK Stack who want to expand into a full observability suite without learning a new ecosystem.
- Search-Centric Troubleshooting: Use the Kibana Query Language (KQL) to perform complex searches across all observability signals (logs, metrics, traces) in a single interface, uncovering correlations that other tools might miss. This is its superpower.
- AIOps Capabilities: Features like anomaly detection, log spike detection, and root cause analysis help automatically surface performance deviations and identify probable causes, reducing manual effort in large-scale systems.
- Flexible Pricing Control: The pricing model is based on data ingested and retained, with a generous free egress allowance. This allows teams to precisely tune their spending based on data value and compliance needs, storing less critical data more cheaply.
Our Take: Elastic's core advantage is its unparalleled search and analytics engine. For teams that believe the answer to any problem is buried in their logs, Elastic provides the most powerful shovel to dig it out, making it an essential tool for deep, investigative diagnostics where context is king.
| Feature | Details |
|---|---|
| Deployment Model | SaaS (Elastic Cloud), Self-managed |
| Core Focus | Log-centric observability and powerful search analytics |
| Pricing | Ingest/retention per GB. Free and paid tiers available. |
| Primary Advantage | Powerful, flexible search and query capabilities across all data types |
| Main Limitation | Costs scale directly with data volume, requiring a disciplined data sizing and retention strategy |
Website: https://www.elastic.co/pricing/serverless-observability/
7. LogicMonitor
LogicMonitor is a SaaS-based hybrid observability platform specializing in complex infrastructure, network, and cloud monitoring. Marketed as LM Envision, it is recognized as one of the best infrastructure monitoring tools for organizations managing hybrid estates and for Managed Service Providers (MSPs). The platform's core strength lies in its powerful auto-discovery capabilities and extensive library of pre-configured monitoring templates, which significantly accelerate deployment across diverse IT environments, from on-premise servers to multi-cloud deployments.
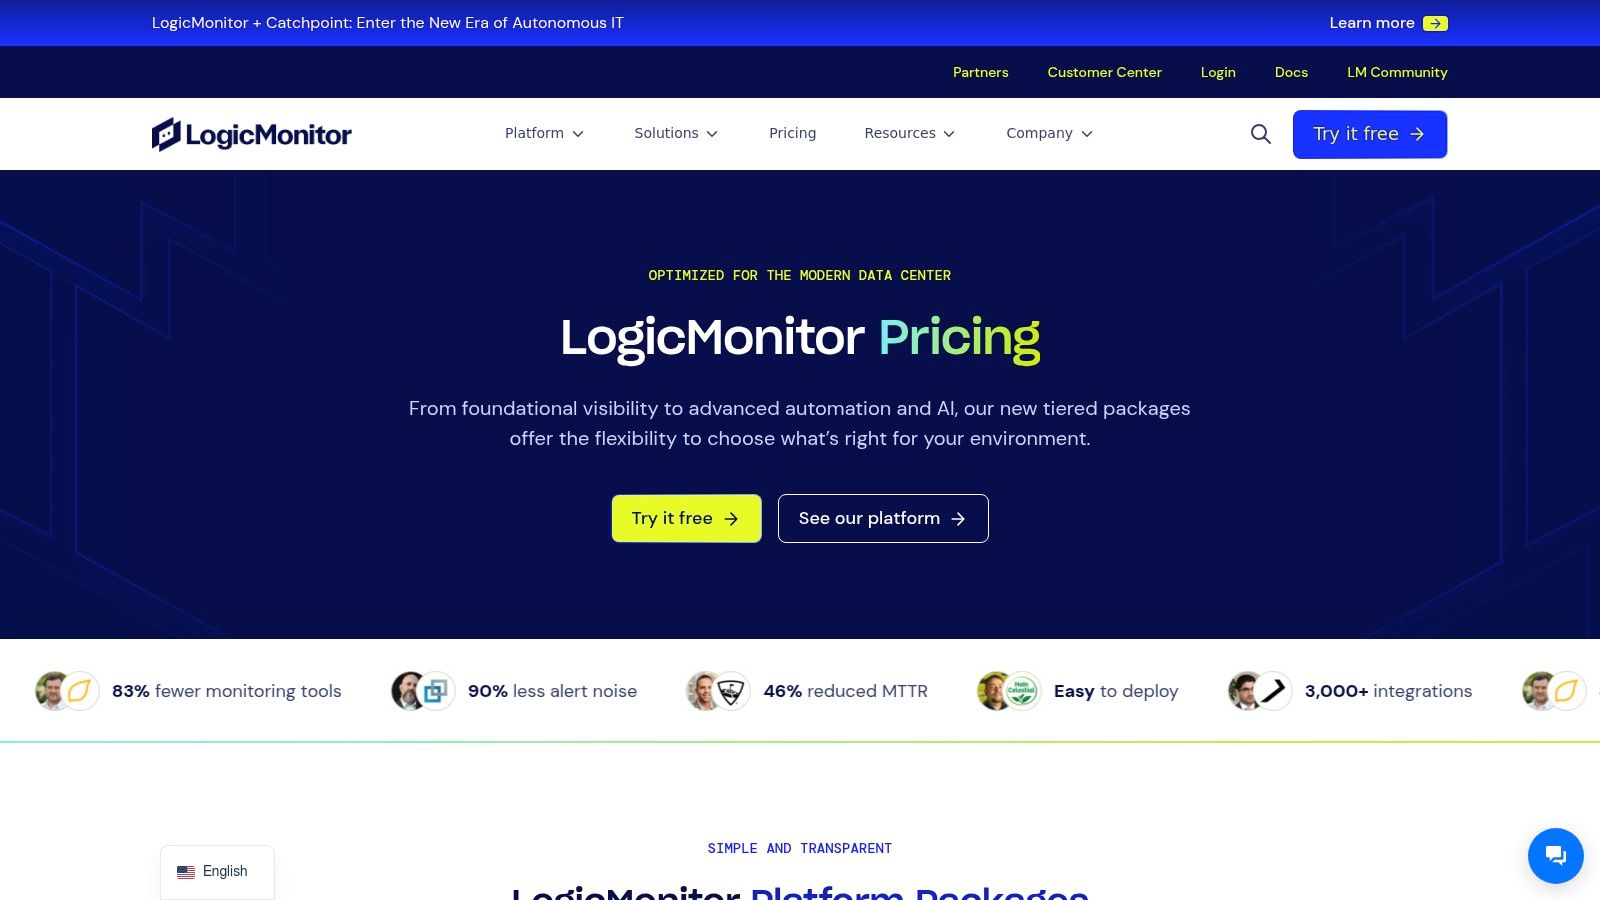
This agent-based system automatically identifies and begins monitoring network devices, servers, and cloud resources, applying best-practice alert thresholds out of the box. This reduces the manual configuration burden on IT teams and ensures comprehensive coverage. LogicMonitor provides transparent, unit-based pricing tiers, making it easier for businesses to predict costs and scale their monitoring strategy as their infrastructure grows. Its availability on the AWS Marketplace further simplifies procurement for cloud-centric organizations.
Key Features & Use Cases
- Ideal Use Case: Enterprises with a mix of on-premises data centers and multi-cloud infrastructure, or MSPs that need a scalable, multi-tenant monitoring solution to manage client environments effectively and efficiently.
- Automated Onboarding: The platform's auto-discovery and template-based approach is ideal for rapidly onboarding hundreds or thousands of devices without extensive manual setup. This "time to value" is a major selling point for busy IT departments.
- AIOps Capabilities: The optional Edwin AI add-ons provide intelligent event correlation and root cause analysis, helping teams cut through alert noise and focus on critical issues that truly impact business services.
- Predictable Pricing: Its tiered, per-unit pricing model (Essentials, Advanced, Signature) offers clear visibility into costs, with volume discounts available for larger deployments, which appeals to budget-conscious managers.
Our Take: LogicMonitor's predictable packaging and strong focus on hybrid IT make it a compelling choice for established enterprises. Its ability to monitor everything from legacy network hardware to modern cloud services in a single platform addresses a critical gap for teams undergoing digital transformation, providing a unified view across old and new worlds.
| Feature | Details |
|---|---|
| Deployment Model | SaaS (Software as a Service) |
| Core Focus | Hybrid infrastructure and network performance monitoring |
| Pricing | Per-device/resource tiers with published unit pricing. Available on AWS Marketplace. |
| Primary Advantage | Strong auto-discovery and pre-built templates for fast time-to-value |
| Main Limitation | Advanced AIOps features are an add-on; initial tiers have device/resource caps |
Website: https://www.logicmonitor.com/pricing
8. Zabbix
Zabbix is an enterprise-grade, open-source infrastructure monitoring platform designed for organizations that prefer a self-hosted solution. It provides a powerful, all-in-one tool for monitoring servers, network devices, applications, and services without any software licensing fees. This makes it one of the best infrastructure monitoring tools for teams with the technical expertise to manage their own monitoring stack and a desire to avoid vendor lock-in and escalating subscription costs, giving them full control and data sovereignty.
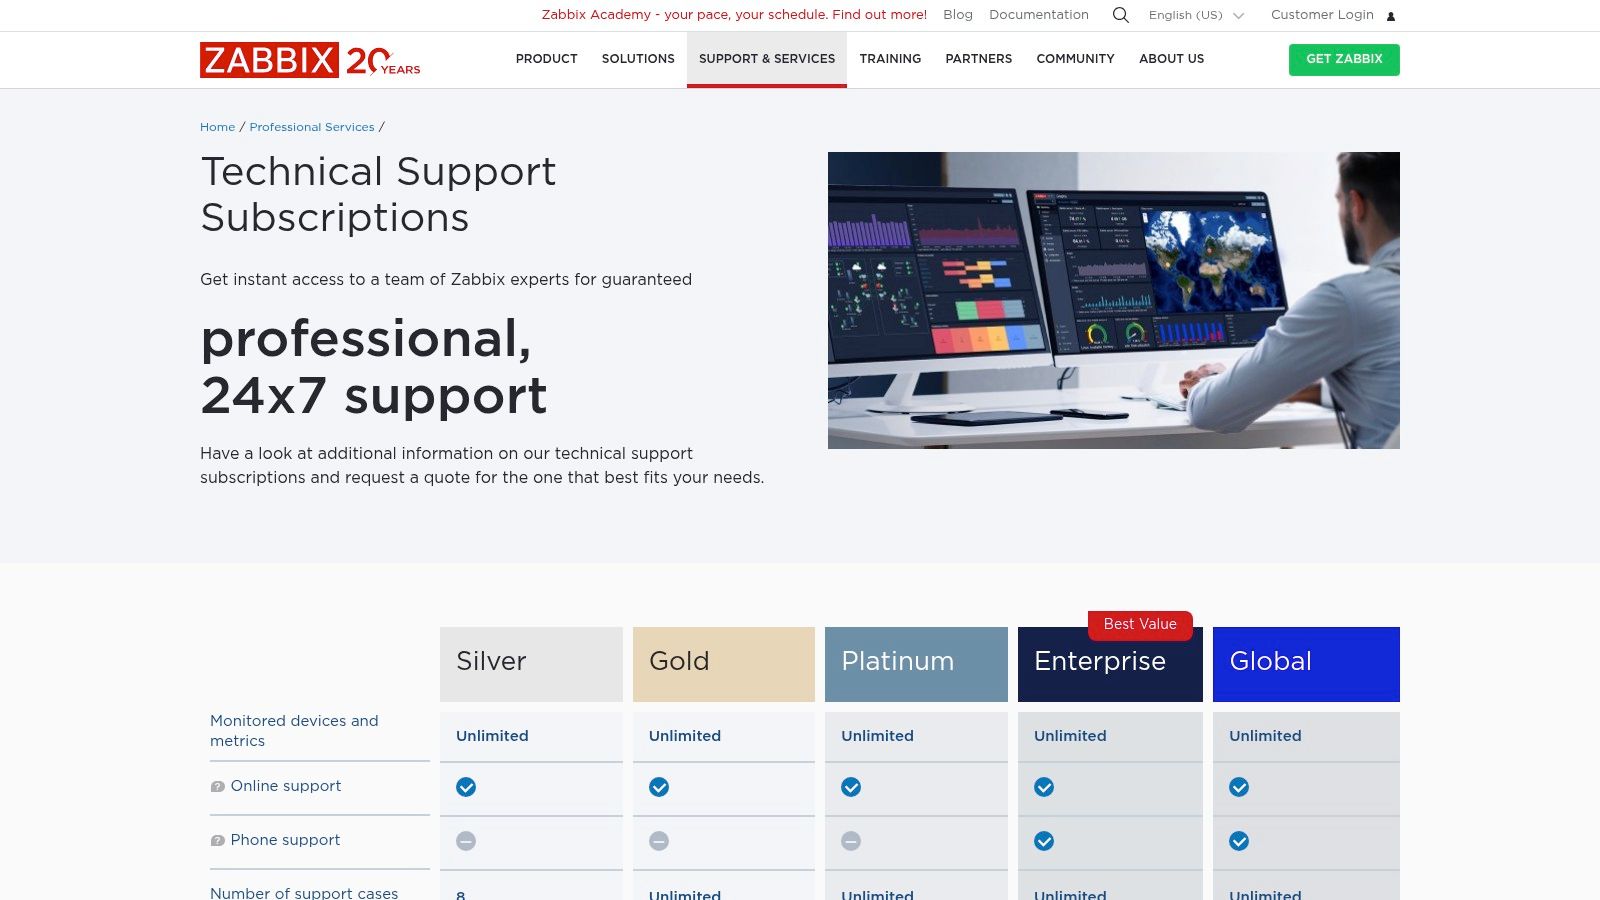
The platform combines agent-based and agentless monitoring, using pre-built templates and auto-discovery to streamline the setup process for common technologies. While the software is free, Zabbix offers optional commercial support subscriptions with defined SLAs, ranging from business-hour assistance to 24/7 global coverage. This hybrid model offers the flexibility of open-source with the reliability of enterprise support, making it a proven choice for monitoring large-scale, complex environments.
Key Features & Use Cases
- Ideal Use Case: Cost-conscious organizations, government agencies, and enterprises with in-house IT/DevOps teams that require full control over their monitoring data and infrastructure. It's excellent for environments with a mix of modern and legacy systems.
- Flexible Data Collection: Supports various collection methods, including Zabbix agent, SNMP, IPMI, and custom scripts, allowing you to monitor virtually anything from server performance to environmental sensors in a data center.
- Advanced Problem Detection: Allows for the creation of complex logical trigger expressions, providing highly granular and flexible alerting conditions that reduce alert fatigue by only notifying on actionable, high-impact events.
- Extensible and Scalable: The architecture is designed to scale to hundreds of thousands of monitored devices, and its functionality can be extended via custom modules and integrations with its robust API, ensuring it can grow with your needs.
Our Take: Zabbix's greatest strength is its total cost of ownership. By eliminating license fees, it empowers teams to scale their monitoring capabilities without financial constraints, provided they can invest the operational resources to maintain the platform. For the right team, it's an incredibly powerful and cost-effective solution.
| Feature | Details |
|---|---|
| Deployment Model | Self-hosted (On-premises or cloud) |
| Core Focus | Network, server, application, and services monitoring |
| Pricing | Free and open-source software; optional paid support tiers. |
| Primary Advantage | No software licensing costs and complete control over the environment |
| Main Limitation | Requires significant internal expertise for setup, maintenance, and scaling compared to SaaS solutions |
Website: https://www.zabbix.com/support
9. Nagios XI
Nagios XI is the commercial, enterprise-grade version of the open-source Nagios Core, offering a powerful, self-hosted infrastructure monitoring solution. It is built for organizations that require full control over their monitoring data and infrastructure, making it ideal for on-premises or strictly regulated environments. Unlike many modern SaaS platforms, Nagios XI provides a more traditional approach with a perpetual licensing model, appealing to teams that prefer a one-time capital expenditure over recurring subscriptions.
Its primary strength lies in its extensive plugin ecosystem, which has grown over decades to support thousands of different hardware devices, services, and applications. The platform's wizard-based configuration simplifies the process of adding new hosts and services, lowering the barrier to entry compared to configuring Nagios Core from scratch. This makes it one of the best infrastructure monitoring tools for teams managing diverse and legacy systems alongside modern components.
Key Features & Use Cases
- Ideal Use Case: System administrators in environments with strict data residency requirements (e.g., government, finance, healthcare) or those who need to monitor a wide array of non-standard or legacy network devices like switches, routers, and firewalls.
- Extensive Plugin Architecture: With over 3,500 community-developed and official plugins, Nagios XI can monitor virtually anything, from network switches and routers to server health and specific application metrics. If it has an IP address, Nagios can probably monitor it.
- Advanced Reporting and Capacity Planning: Generate detailed reports on availability, performance, and SLAs. Capacity planning tools help forecast future infrastructure needs based on historical trend data, enabling proactive resource management.
- Configuration Wizards: A key differentiator from its open-source counterpart, these wizards guide users through the process of monitoring new devices and services, significantly reducing setup time and complexity for common tasks.
Our Take: Nagios XI shines in its reliability and predictability. The perpetual license model is a major draw for organizations with fixed IT budgets, and its robust, time-tested architecture provides a level of stability that is critical for monitoring core business infrastructure. It is a workhorse for traditional IT operations.
| Feature | Details |
|---|---|
| Deployment Model | Self-hosted (On-premises or private cloud) |
| Core Focus | Network, server, and application state monitoring (up/down, performance checks) |
| Pricing | Perpetual license based on the number of nodes. Standard and Enterprise editions available. |
| Primary Advantage | Unmatched flexibility through plugins and full data control in a self-hosted environment |
| Main Limitation | The user interface and user experience can feel dated; requires more administrative overhead than SaaS tools. |
Website: https://www.nagios.com/products/nagios-xi/
10. Prometheus
Prometheus is a powerful, open-source monitoring and alerting toolkit originally built at SoundCloud and now a graduated project of the Cloud Native Computing Foundation (CNCF). It has become the de-facto standard for monitoring in Kubernetes and cloud-native environments. Unlike push-based systems, Prometheus actively pulls metrics from configured endpoints, stores them in a multi-dimensional time-series database, and provides a powerful query language (PromQL) to analyze that data.
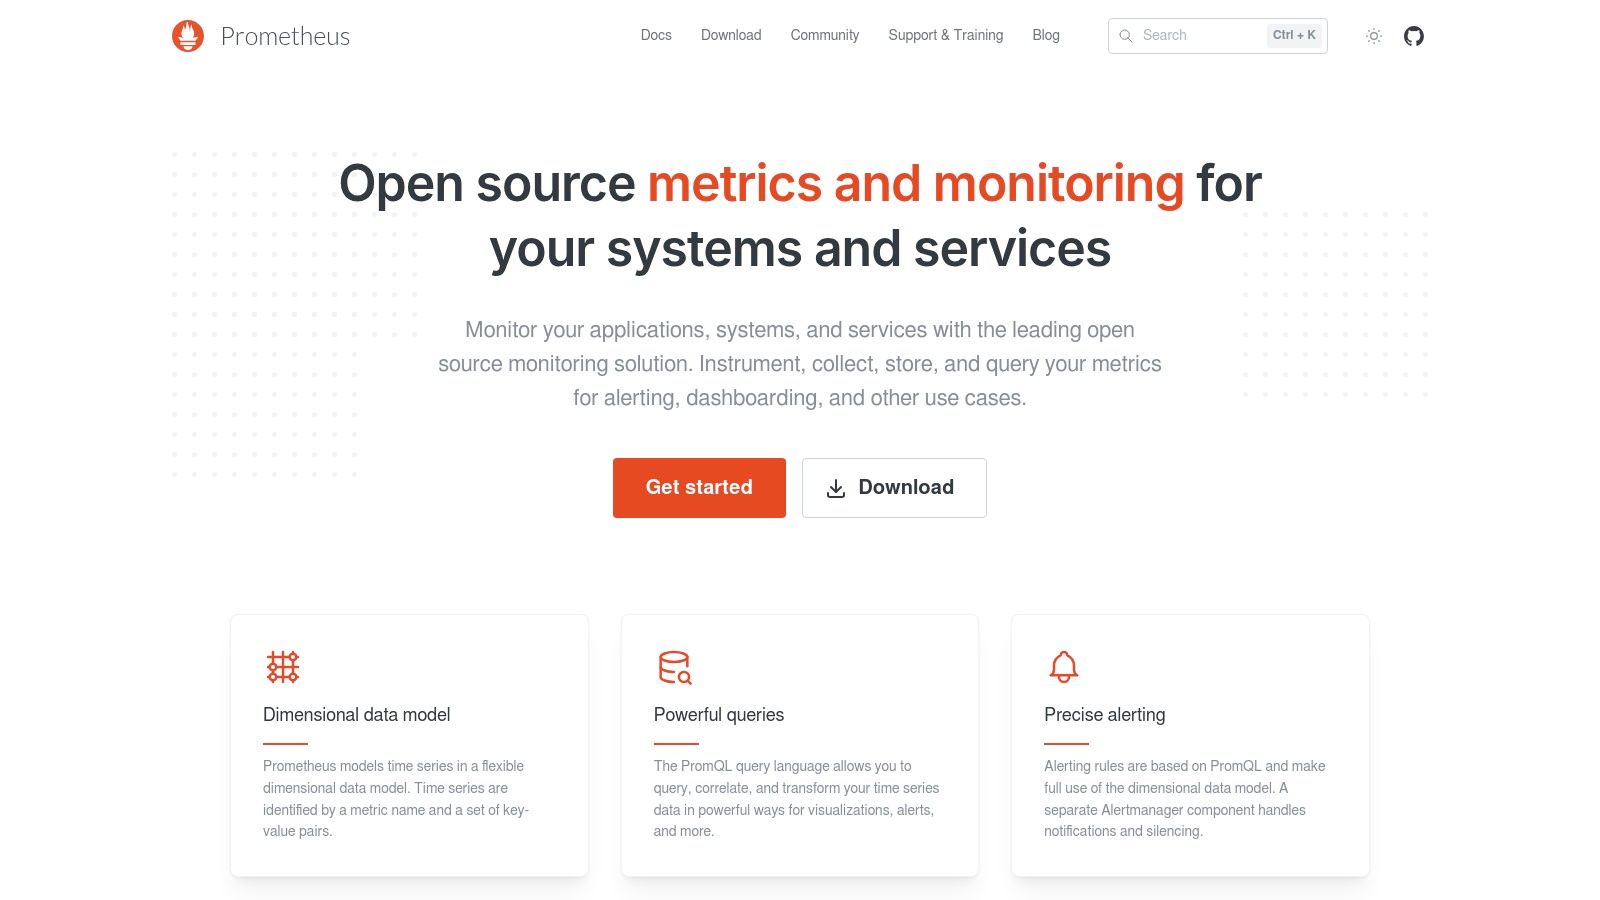
Its pull-based architecture, combined with service discovery, makes it exceptionally well-suited for dynamic containerized workloads where services are constantly being created and destroyed. The vast ecosystem of "exporters" allows Prometheus to scrape metrics from hundreds of third-party systems, from databases to hardware. When paired with Grafana for visualization and Alertmanager for notifications, it forms a complete, self-hosted observability stack, making it one of the best infrastructure monitoring tools for teams wanting full control.
Key Features & Use Cases
- Ideal Use Case: Engineering teams that run containerized workloads on Kubernetes and need a flexible, powerful, and cost-effective metrics solution. It's perfect for organizations with the technical expertise to manage their own monitoring infrastructure from the ground up.
- Multi-Dimensional Data Model: Time series are identified by a metric name and a set of key-value pairs (labels), enabling flexible and powerful querying with PromQL to slice and dice data in ways that flat metric systems cannot.
- Pull-Based Collection: Simplifies instrumentation by having the Prometheus server scrape HTTP endpoints, making it easy to discover and monitor new services automatically without requiring application-level configuration changes.
- Extensive Ecosystem: Integrates natively with Alertmanager for sophisticated alerting rules and Grafana for rich, interactive dashboards. A massive community contributes exporters for nearly any technology imaginable.
Our Take: Prometheus empowers teams with unparalleled control and flexibility over their metrics pipeline. While it requires operational overhead, its powerful data model and deep integration with the cloud-native ecosystem make it an indispensable tool for understanding the performance of modern, complex systems. It's the choice of the modern SRE.
| Feature | Details |
|---|---|
| Deployment Model | Self-hosted (Open Source) or Managed SaaS options (e.g., Grafana Cloud, AWS Managed Prometheus) |
| Core Focus | Time-series metrics collection, querying, and alerting |
| Pricing | Free and open-source. Costs are associated with hosting infrastructure or managed service fees. |
| Primary Advantage | Powerful PromQL, deep Kubernetes integration, and a vast, extensible ecosystem |
| Main Limitation | Requires significant operational effort to manage for high availability, long-term storage, and scale |
Website: https://prometheus.io/
11. AWS Marketplace – Monitoring & Observability
AWS Marketplace isn't a monitoring tool itself, but rather a curated digital catalog that simplifies finding, buying, and deploying software that runs on AWS. For teams deeply embedded in the Amazon ecosystem, it acts as a centralized procurement hub for some of the best infrastructure monitoring tools, streamlining billing and vendor management. Instead of managing separate contracts and invoices, you can subscribe to top-tier observability platforms directly through your existing AWS account.
This approach is highly beneficial for enterprise governance, as it allows organizations to leverage pre-approved AWS budgets and procurement channels. The marketplace lists SaaS subscriptions, container images, and Amazon Machine Images (AMIs), often with one-click deployment options. It also provides access to Vendor Insights, a feature that helps with security and compliance vetting by centralizing vendor risk assessment artifacts, which is a major time-saver for security teams.
Key Features & Use Cases
- Ideal Use Case: AWS-centric organizations looking to consolidate vendor procurement and billing for their monitoring stack. It's perfect for teams that need to adhere to strict corporate purchasing policies and leverage existing AWS Enterprise Agreements to get better pricing.
- Streamlined Procurement: Subscribe to monitoring tools using your AWS account, which adds the software charges to your consolidated AWS bill. This simplifies accounting and budget management significantly, removing administrative friction.
- Private Offers: Enables negotiation of custom pricing and terms directly with software vendors, all managed within the AWS Marketplace platform, allowing enterprises to secure favorable deals without complex legal processes.
- Governance and Compliance: Use AWS Identity and Access Management (IAM) to control who can procure software, ensuring that only approved tools are deployed, which helps prevent shadow IT and maintains architectural standards.
Our Take: AWS Marketplace excels at reducing administrative overhead. For companies already spending significantly on AWS, the ability to centralize software purchasing and billing for monitoring tools is a massive operational win, removing friction from the procurement process and allowing engineering teams to get the tools they need faster.
| Feature | Details |
|---|---|
| Deployment Model | Procurement Hub (SaaS, AMIs, Containers, Professional Services) |
| Core Focus | Centralized discovery, procurement, and billing for third-party software on AWS |
| Pricing | Varies by vendor; transactions are handled through your AWS account. |
| Primary Advantage | Consolidated billing and simplified procurement within the AWS ecosystem |
| Main Limitation | Primarily serves AWS environments; pricing can be less transparent (contact seller often required) |
Website: https://aws.amazon.com/marketplace/
12. G2 – Cloud Infrastructure Monitoring category
G2 is a peer-to-peer review site that serves as an essential research hub rather than a direct monitoring tool. Its Cloud Infrastructure Monitoring category aggregates user reviews, ratings, and detailed product data for dozens of vendors. This makes it an invaluable resource for shortlisting the best infrastructure monitoring tools by validating vendor marketing claims with authentic, crowd-sourced feedback from verified users in similar roles or industries.
The platform provides comparison grids, "Best Of" badges, and market segment filters that allow you to quickly narrow down options based on your specific needs, like company size or required features. Instead of relying solely on a vendor's website, G2 offers a more objective viewpoint by compiling pros and cons from a wide array of real-world experiences, helping you understand both the strengths and weaknesses of each solution before committing to a demo. This is a critical first step in any evaluation process.
Key Features & Use Cases
- Ideal Use Case: Teams in the initial research phase trying to build a shortlist of potential monitoring tools. It's perfect for comparing top players like Datadog and Dynatrace against emerging solutions based on user satisfaction and feature sets.
- Aggregated Reviews: Consolidates pros and cons from numerous verified user reviews, offering a balanced perspective on a tool's performance, ease of use, and support quality. Look for patterns in feedback from users with similar company profiles.
- Market Segment Filtering: Allows you to filter tools by company size (small business, mid-market, enterprise) to find solutions that are a good fit for your scale and budget, ensuring you don't evaluate tools that are too simple or too complex for your needs.
- Feature & Pricing Comparison: Provides structured data to compare vendors side-by-side on key features, deployment types, and pricing models, streamlining the evaluation process and helping you build a business case for your preferred solution.
Our Take: G2's power lies in its ability to cut through the marketing noise. Using its filters to see what tools are popular with companies of your size is a highly effective strategy to create a relevant and manageable shortlist for further evaluation. It provides the social proof needed to make a confident decision.
| Feature | Details |
|---|---|
| Deployment Model | Website (Peer-to-peer review platform) |
| Core Focus | Aggregating user reviews and comparative data for software buyers |
| Pricing | Free to access for research and reviews |
| Primary Advantage | Provides unbiased, crowd-sourced feedback to validate vendor claims and compare tools objectively |
| Main Limitation | Sponsored placements can influence visibility; review details should always be cross-checked on vendor sites |
Website: https://www.g2.com/categories/cloud-infrastructure-monitoring
Top 12 Infrastructure Monitoring Tools Comparison
| Tool | Core features & USP ✨ | Experience / Quality ★ / 🏆 | Target audience 👥 | Pricing / Value 💰 |
|---|---|---|---|---|
| Datadog | Full‑stack metrics, logs, traces; 600+ integrations; AI Watchdog ✨ | ★★★★☆ Fast time‑to‑value; enterprise controls 🏆 | Mid→large teams wanting integrated SaaS 👥 | 💰 Flexible (host/container/custom); can grow with cardinality |
| New Relic | Unified infra/APM/logs/browser/synthetics; OpenTelemetry‑friendly ✨ | ★★★★ Simple ramp from free tier; scalable | Small → growing teams, startups 👥 | 💰 Usage‑based with generous free tier; plan for high ingest |
| Dynatrace | Full‑stack + Davis AI causal analysis; Smartscape topology ✨ | ★★★★★ Deep automation & root‑cause 🏆 | Enterprises needing strong automation & causal analysis 👥 | 💰 Transparent hourly rates; requires workload mapping |
| Grafana Cloud | Managed Prometheus/Loki/Tempo + Grafana; native OTel ✨ | ★★★★ Good cloud‑native UX; strong dashboards | Cloud‑native teams preferring OSS & managed backends 👥 | 💰 Always‑free tier + on‑demand per series/GB/host‑hour |
| Splunk Observability Cloud | Full‑fidelity tracing, APM, RUM, integrated security ✨ | ★★★★ High‑throughput, enterprise grade 🏆 | Large orgs and high‑throughput services 👥 | 💰 Entity/activity pricing; sales‑led, enterprise focus |
| Elastic Observability | Search‑centric logs/metrics/traces; ingest/retention model ✨ | ★★★★ Powerful troubleshooting at scale | Teams that prefer search‑first ops & ingest control 👥 | 💰 Ingest/retention pricing; costs scale with volume |
| LogicMonitor | Hybrid infra & network monitoring; auto‑discovery, Edwin AI ✨ | ★★★ Predictable packaging for hybrid estates | MSPs and hybrid/cloud enterprises 👥 | 💰 Per‑unit pricing with volume discounts; published tiers |
| Zabbix | Open‑source self‑hosted monitoring with templates & auto‑discovery ✨ | ★★★ Proven at scale; community + paid support | Teams wanting no‑license self‑hosted control 👥 | 💰 Free software; optional paid support (8×5→24×7) |
| Nagios XI | On‑prem/hybrid monitoring; large plugin ecosystem; perpetual license ✨ | ★★★ Strong on‑prem control; mature tooling | Regulated or strictly on‑prem environments 👥 | 💰 Perpetual node/site licensing; predictable renewals |
| Prometheus | CNCF metrics TSDB + PromQL; exporters & Alertmanager ✨ | ★★★★ Ubiquitous for Kubernetes/cloud‑native | Cloud‑native/Kubernetes teams and SREs 👥 | 💰 Free to run; ops cost for scaling/long‑term storage |
| AWS Marketplace – Monitoring & Observability | Centralized procurement, billing, private offers ✨ | ★★★ Streamlines vendor procurement for AWS buyers | AWS‑centric procurement teams & enterprises 👥 | 💰 Consolidated AWS billing; vendor pricing varies |
| G2 – Cloud Infrastructure Monitoring category | Crowd‑sourced reviews, grids, Best‑Of badges ✨ | ★★★ Helpful peer validation & rankings | Buyers shortlisting vendors and comparing reviews 👥 | 💰 Free to use; some sponsored placements to note |
Beyond the Dashboard: Turning Monitoring Data into Action
Navigating the landscape of the best infrastructure monitoring tools can feel overwhelming. We've journeyed through a comprehensive list, from all-in-one SaaS giants like Datadog and New Relic to powerful open-source solutions like Prometheus and Zabbix. Each tool offers a unique blend of features, pricing models, and deployment complexities designed to cater to different operational needs and organizational scales. Your goal is not to find a universally "perfect" tool, but the one that is perfect for your team and your systems.
The core takeaway is that the "best" tool isn't a one-size-fits-all answer. It's a strategic choice deeply tied to your specific context. The ideal solution depends on your team's expertise, budget constraints, existing technology stack, and future scalability goals. A lean startup might thrive with the flexibility of a Grafana and Prometheus stack, while an enterprise demanding AI-driven root cause analysis may find Dynatrace or Splunk indispensable. Understanding these trade-offs is paramount.
Synthesizing Your Selection Strategy
To distill this extensive review into actionable steps, consider these critical decision points before committing to a platform. This framework will help you move from a list of options to a confident choice.
- Total Cost of Ownership (TCO) vs. Sticker Price: Don't just look at the monthly subscription fee. Factor in the engineering hours required for setup, maintenance, and customization, especially for open-source tools. A seemingly "free" tool like Prometheus can become expensive when you account for the personnel needed to manage it effectively at scale. Conversely, a higher-priced SaaS tool might reduce TCO by offloading operational burdens.
- Breadth vs. Depth: Do you need a single platform that covers everything from infrastructure metrics and APM to logging and security (like Datadog or Elastic), or do you prefer best-in-breed tools for each specific function? A unified platform simplifies vendor management and correlation but may lack the specialized depth of dedicated solutions. This is the classic "all-in-one" vs. "best-of-breed" debate.
- Skill Set Alignment: Be realistic about your team's capabilities. A powerful but complex tool like Nagios XI or a self-hosted Elastic Stack will become shelfware if no one has the expertise or bandwidth to manage it. Managed services like Grafana Cloud or LogicMonitor can bridge this gap, offering power without the operational burden. Choose a tool that fits your team, not one that requires you to build a new team around it.
Implementation: From Tool to Workflow
Selecting a tool is just the beginning. The real value of infrastructure monitoring is unlocked when it's deeply integrated into your team's culture and daily workflows. Simply having dashboards is passive; true observability is an active, ongoing practice. It's a cultural shift as much as a technological one.
First, define what "healthy" means for your applications and infrastructure. Establish clear Service Level Objectives (SLOs) and Service Level Indicators (SLIs) for key user journeys. This transforms monitoring from a reactive "is it on fire?" check to a proactive measure of system performance against business goals. Your alerts and dashboards should reflect these objectives directly.
Second, automate your alerting. Alert fatigue is a real problem that leads to critical signals being ignored. Configure intelligent, context-aware alerts that are routed to the right teams through channels like Slack or PagerDuty. Ensure alerts are actionable, providing enough data for engineers to immediately start diagnosing the problem. An alert without context is just noise.
Finally, make observability a team sport. Data from your monitoring tools should inform planning meetings, post-mortems, and performance reviews. When developers, operations, and product teams all share a common view of system health, you foster a culture of shared ownership and collaborative problem-solving, which is the ultimate goal of implementing any of these powerful platforms. The most advanced tool is useless if its data remains siloed within one team.
Feeling overwhelmed by the complexity of setting up and managing a production-ready observability stack? Vibe Connect specializes in helping teams implement robust monitoring, automate CI/CD pipelines, and secure their infrastructure, letting you focus on your product. Get expert, on-demand DevOps and MLOps support to turn monitoring data into a competitive advantage. Learn more at Vibe Connect.