
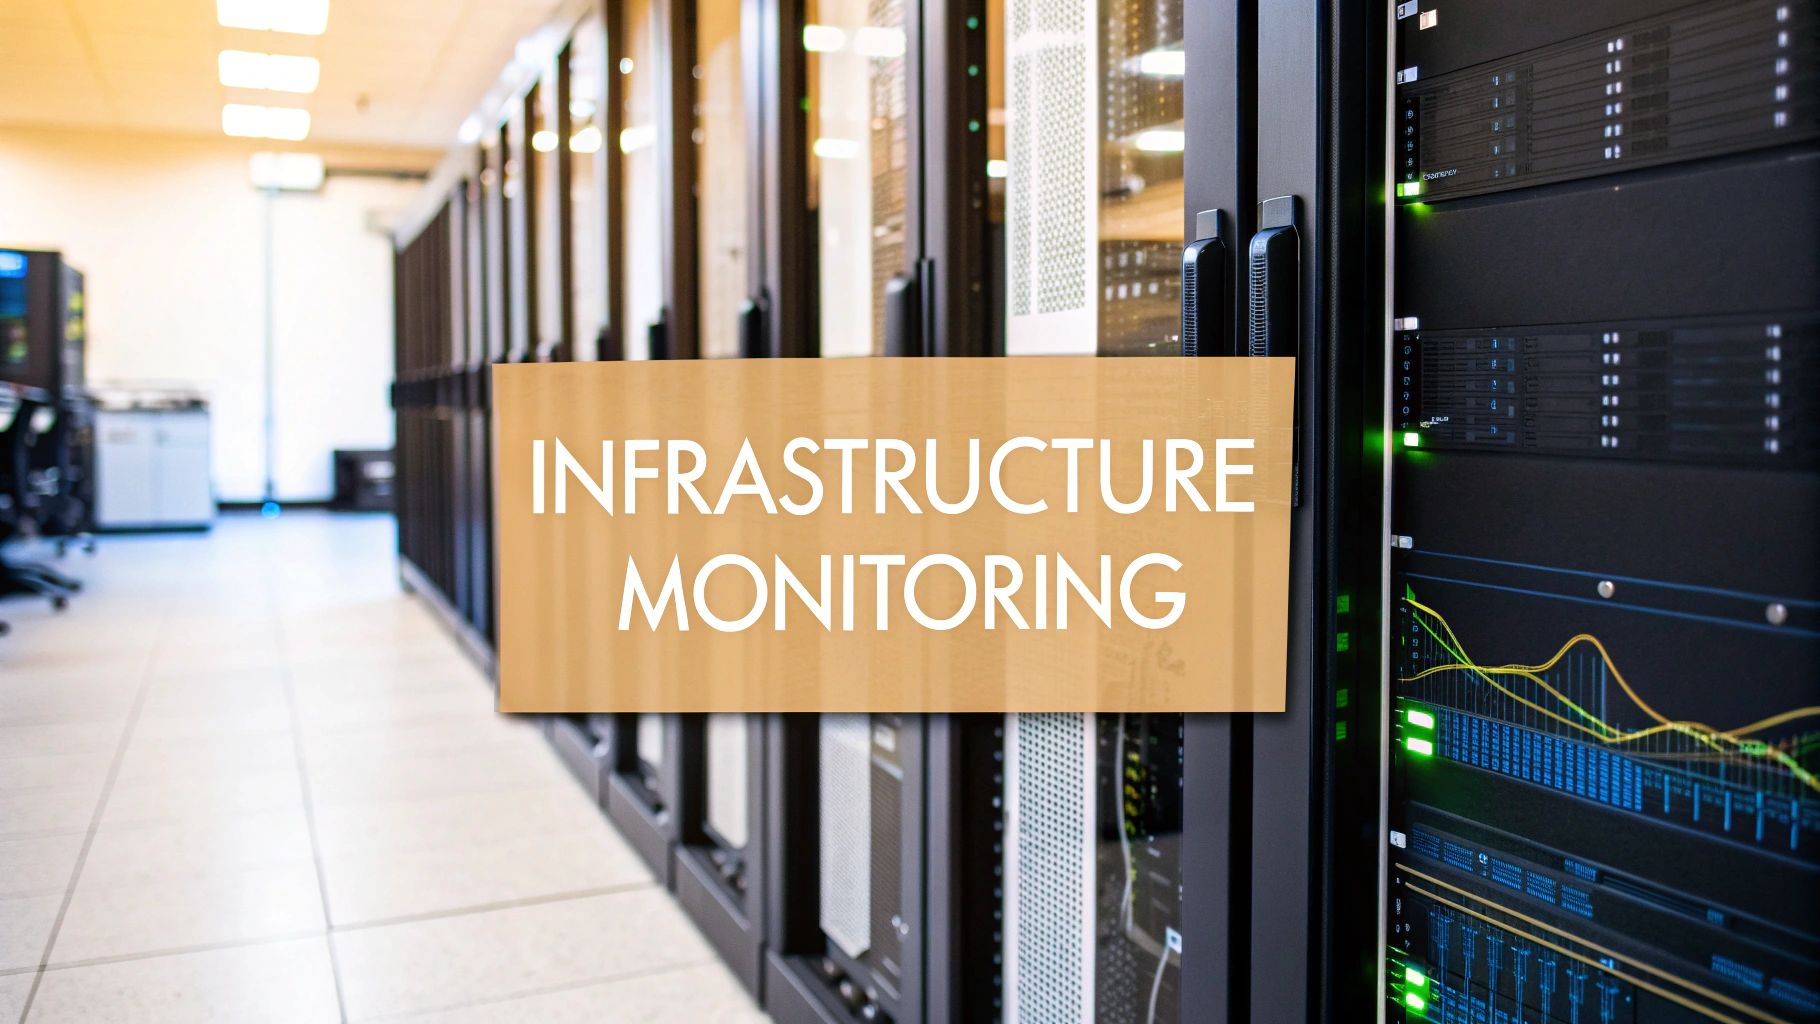
At its core, infrastructure monitoring is the practice of gathering and analyzing data to get a clear picture of the health and performance of your entire tech stack. It's the command center for your digital operations, keeping an eye on everything from servers and databases to networks and cloud services. This constant vigilance is what keeps your applications fast, reliable, and available for your users.
In today's digital-first world, your infrastructure isn't just a backend component; it's the foundation of your entire customer experience. A slow API, a crashing server, or a database bottleneck isn't just a technical glitch—it's a direct threat to your revenue and reputation. Effective infrastructure monitoring transforms this foundation from a potential liability into a strategic advantage, giving you the visibility to prevent problems, optimize performance, and scale with confidence.
Why Monitoring Is Your Business Lifeline

Think about trying to drive a high-performance car without a dashboard. You’re moving, sure, but you have no clue about your speed, fuel level, or if the engine is about to overheat. Running a modern application without infrastructure monitoring is exactly the same—you're just flying blind and hoping for the best.
This isn't just about preventing crashes. It’s about shifting your team's entire mindset from reactive "firefighting" to proactive control. Instead of learning your site is down from angry user emails, you get an alert about a potential problem long before it ever impacts them. This proactive stance is the difference between a business that's constantly putting out fires and one that's consistently delivering a flawless user experience.
Beyond Just Keeping The Lights On
Good infrastructure monitoring is the bedrock of a resilient, scalable business. It hands you the critical intelligence needed to make smart decisions that directly protect your bottom line. It’s the data-driven engine that powers operational excellence and sustainable growth.
Here’s what it really unlocks:
- Optimize User Experience: By tracking metrics like server response times and application error rates, you can pinpoint and crush performance bottlenecks that frustrate users and drive them away. A faster, more reliable app leads directly to higher engagement and conversion rates.
- Make Smart Scaling Decisions: Monitoring resource utilization, like CPU and memory usage, tells you exactly when it's time to add more capacity. This data-driven approach helps you handle traffic spikes smoothly without wasting money on over-provisioned servers you don't need yet.
- Protect Revenue and Reputation: Every minute of downtime costs you money and erodes customer trust. Solid monitoring ensures high availability, which is essential for building a brand people can rely on. This is a key piece of achieving a zero-downtime deployment strategy.
- Improve Developer Productivity: When something breaks, monitoring gives developers the context they need to find the root cause quickly. This dramatically reduces the mean time to resolution (MTTR) and frees up valuable engineering time to focus on building new features instead of debugging production issues.
This proactive approach to system health isn't just a good idea anymore; it's becoming a business necessity. The market numbers tell the story. The global infrastructure monitoring market, valued at USD 5.59 billion, is expected to explode to USD 15.70 billion by 2034, growing at a steady clip of 10.88% annually. This growth is fueled by companies that simply can't afford for their digital services to fail. You can explore more on these market trends at Precedence Research.
A Shift From Reactive To Proactive
Ultimately, understanding infrastructure monitoring means seeing it as a core business function, not just an IT chore. It's an essential ingredient for delivering a consistently great customer experience. It’s the bridge between your technology stack and your business objectives.
By continuously watching over your systems, you transform raw data into actionable insights. This allows you to catch minor issues before they become major outages, ensuring your application isn't just live—it's thriving.
Without it, you're guessing. With it, you have the clarity to build faster, scale smarter, and deliver the reliability your users demand. It builds a stable foundation that lets you focus on innovation, knowing your infrastructure has your back. This shift from guesswork to data-driven decision-making is what separates successful modern businesses from the rest.
Understanding Monitoring Versus Observability
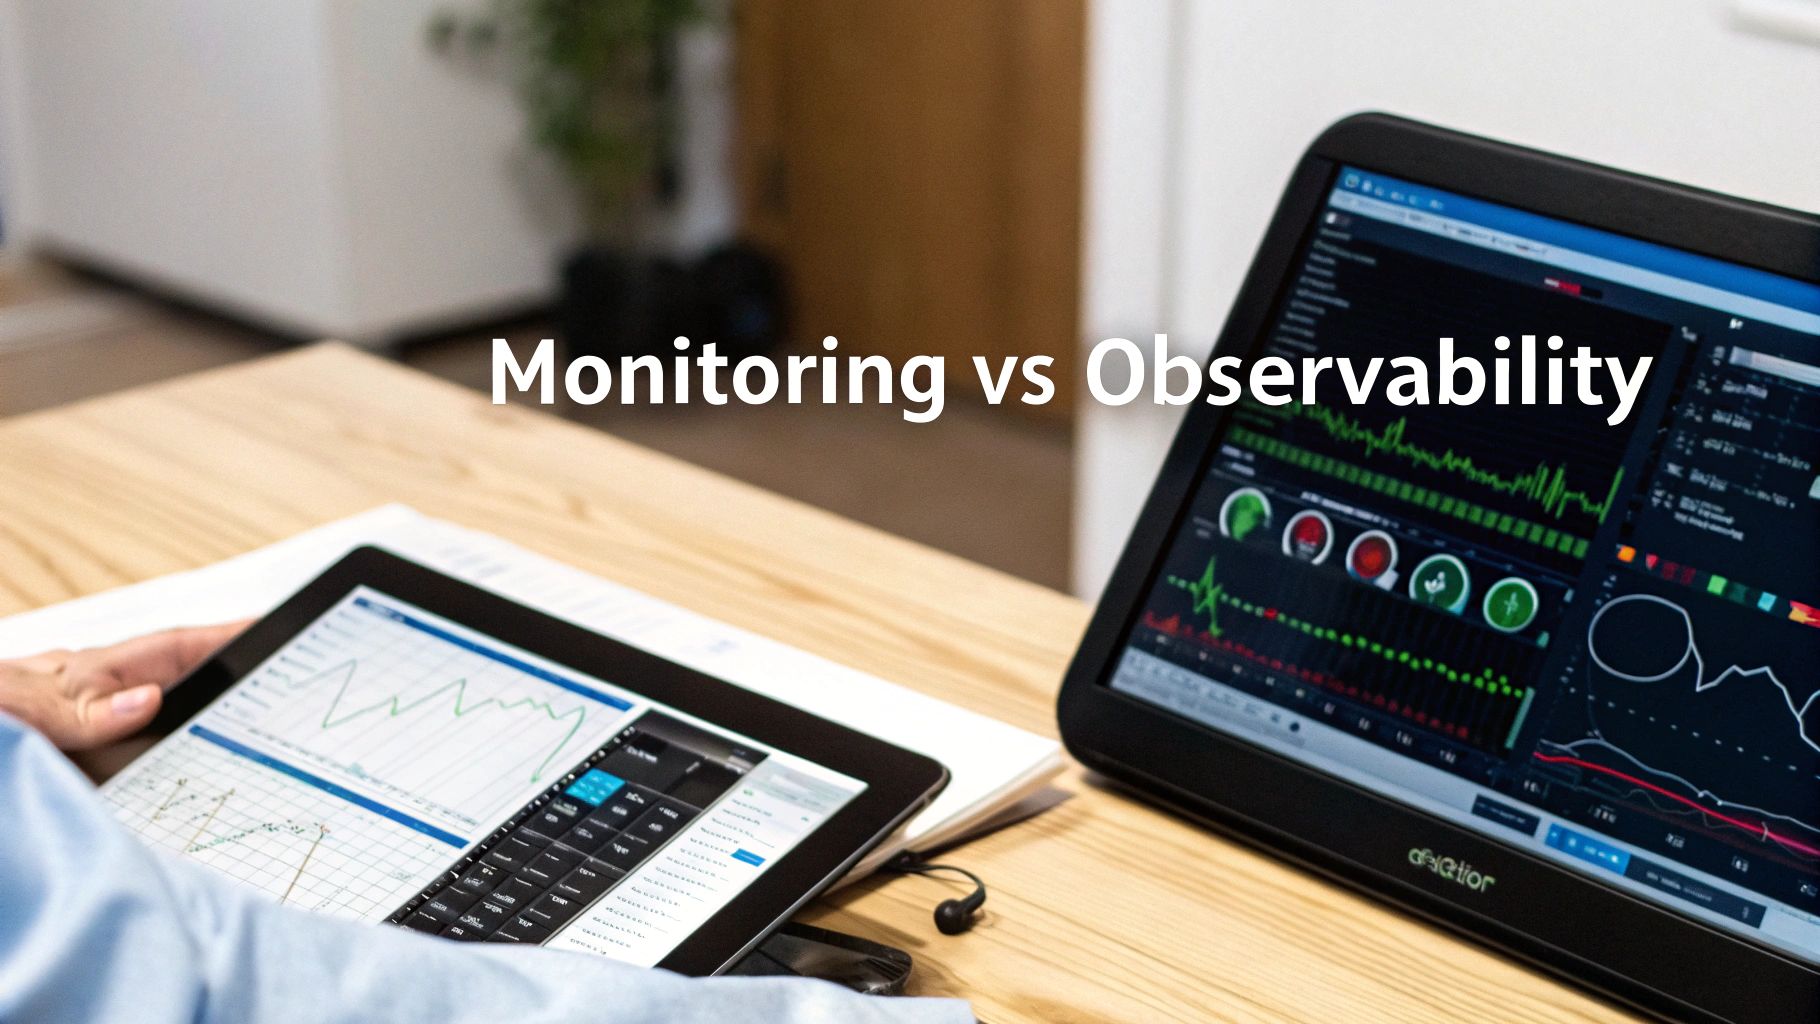
It’s impossible to talk about infrastructure monitoring for long before someone brings up "observability." The terms are often used interchangeably, which creates a lot of confusion. So, are they the same? Not exactly, but they are two peas in a pod—deeply connected and absolutely essential for running modern applications.
A great way to think about it is with a health analogy. Monitoring is like your system's routine checkup. The doctor checks your known vitals—heart rate, blood pressure, temperature—against established healthy ranges. You’re asking questions you already know are important. It’s a planned, structured approach to health assessment.
Monitoring Answers Known Questions
At its core, monitoring is all about tracking predefined metrics and watching for specific thresholds to be crossed. You build dashboards and configure alerts based on what you expect to go wrong. It’s a fundamental, proactive practice that keeps a constant pulse on your infrastructure. It's about defining what "healthy" looks like and getting notified when things deviate from that baseline.
Think of the classic questions monitoring is designed to answer:
- Is our primary database server up and running?
- Are the web server CPUs spiking above 80%?
- Is the log server about to run out of disk space?
- How long are requests to our main API taking?
This approach is perfect for catching predictable problems. When a server crashes or a disk fills up, a solid monitoring setup fires off an alert, and your team can jump on it immediately. It’s the bedrock of system reliability and operational stability.
But monitoring has its blind spots. It’s great at telling you what broke, but it often falls short of explaining why it broke. This is especially true in complex, distributed systems where one small failure can trigger a cascade of bizarre, unpredictable issues. And that’s where observability steps in.
Observability Explores Unknown Problems
If monitoring is the scheduled checkup, observability is the full diagnostic workup you get when you show up with weird, new symptoms. It’s the ability to truly understand what’s happening inside your system just by looking at the data it produces. It’s not about pre-defined questions; it's about having the capability to ask any question about your system's state.
Observability isn’t about staring at predefined dashboards. It’s about having rich, high-context data—typically from metrics, logs, and traces—that empowers engineers to ask new, exploratory questions on the fly. It’s designed for tackling the "unknown unknowns"—the problems you never anticipated and couldn't have built a dashboard for.
Observability lets you go beyond a simple "Service X is slow" alert. It gives you the power to discover that Service X is slow only for users in Australia, on the latest app version, because a downstream microservice is hitting a new bottleneck.
This isn't just a nice-to-have feature; it’s a flat-out necessity for modern application architectures. With microservices, serverless functions, and a web of third-party APIs, the number of things that can go wrong has exploded. A simple monitoring alert just doesn’t give you enough information to navigate that kind of complexity. Observability provides the tools for deep, investigative debugging.
Why You Need Both
Monitoring and observability aren't rivals. They are two sides of the same coin, each playing a critical and complementary role. In fact, you can't achieve real observability without first collecting the raw data through monitoring. Monitoring provides the "what," and observability provides the "why."
Here’s the simple way to remember their relationship:
- Monitoring is the action of collecting and displaying data based on pre-defined criteria. It tells you what is happening.
- Observability is a property of the system that lets you ask any question of that data to understand its internal state. It helps you find out why it's happening.
Ultimately, a strong infrastructure strategy needs both. Monitoring acts as your first line of defense, catching known issues and flagging important trends through dashboards and alerts. Observability gives you the deep-dive diagnostic tools to solve novel, complex problems you could never have predicted. Combine them, and your team can not only fix what's broken but truly understand and improve the entire system for long-term resilience.
The Building Blocks of a Healthy System

To really get a grip on what's happening inside your infrastructure, you need to be collecting the right data. Monitoring is great for watching known problems, but true observability demands a much richer dataset. This is where the “three pillars of observability” come in: metrics, logs, and traces.
These aren't just buzzwords; they’re the essential ingredients for building a complete, 3D picture of your system's health. Think of them as a team of detectives, each bringing a unique skill to an investigation. One gives you the high-level overview, another provides the detailed eyewitness accounts, and the third maps out the entire sequence of events.
Let’s make this real. Imagine a customer on your e-commerce site clicks the "Complete Purchase" button. That single click kicks off a whole chain of events, and each of our data "detectives" will capture a different part of the story.
Metrics: The Numbers That Tell a Story
Metrics are your system’s vital signs. They're numerical data points collected over time—things like CPU usage, memory consumption, or the number of API requests per second. They are lightweight, aggregated, and perfect for dashboards because they quickly show you trends, patterns, and red flags at a glance.
Back to our e-commerce site. A flash sale is on, and thousands of users are hitting "Complete Purchase." Metrics are the first to sound the alarm:
- Server Requests: You’d see a massive spike in requests hitting your order processing service.
- CPU Utilization: The database server's CPU might jump from a sleepy 20% to a frantic 90%.
- Latency: The average time to confirm an order could creep up from 200ms to a painful 2 seconds.
Metrics are fantastic for telling you that something is wrong. That spike in latency is a clear signal of trouble, but it doesn't explain why it's happening. It's the symptom, not the cause. For that, we need to dig deeper.
Logs: The Detailed Journal Entries
If metrics are the vital signs, logs are the detailed, timestamped journal entries of every event. Each log is a specific action: a user logging in, a database query running, or an error code popping up. Logs provide the granular, unstructured context that metrics just can't. They are the ground truth of what your application was doing at a specific moment in time.
So, our customer's purchase is dragging. This is where we turn to the logs to get the ground truth. A developer could filter the logs for that specific transaction and find a story unfolding:
INFO: User 123 added item 'Product A' to cart.INFO: Initiating payment with processor...ERROR: Payment gateway timeout after 1500ms.WARN: Retrying payment for order 456...
Aha! The "why" suddenly snaps into focus. The latency wasn't a database issue at all; it was a slow response from a third-party payment gateway. Logs give you the exact error message, stack trace, and context you need to start fixing things.
Traces: The Complete Journey Map
Traces are the final piece of the puzzle. While logs show individual events and metrics show high-level trends, a trace connects all the dots. It gives you a complete, end-to-end map of a single request as it travels through all the different microservices in your system. This is especially crucial in modern, distributed architectures.
For our e-commerce purchase, a trace would visualize the entire journey:
- The request kicks off at the front-end web server when the user clicks "buy."
- It zips over to the authentication service to verify the user.
- Next, it calls the inventory service to make sure the item is in stock.
- Then, it hits the payment service, which contacts the external gateway.
- Finally, it reaches the order confirmation service to seal the deal.
Each step is timed, revealing exactly where the bottlenecks are. A trace would paint a clear picture: the call to the external payment gateway took a whopping 1.5 seconds, while every internal service responded in under 50ms.
By combining metrics, logs, and traces, you move from simply knowing your system is slow to pinpointing the exact line of code or external dependency that's causing the issue. This powerful combination is the core of modern infrastructure monitoring and observability.
The demand for this level of insight is exploding. Data infrastructure monitoring is projected to leap from USD 486.3 million in 2025 to over USD 2 billion by 2035. This growth is fueled by AI workloads and complex cloud systems where smart performance tuning can boost application reliability by up to 40%. You can explore more data on this expanding market at Market.us. Of course, once you have this data, you need the right application performance monitoring tools to make sense of it all.
Key Metrics Every Founder Should Track
Alright, let's move from theory to what actually matters on the ground. When you first dive into monitoring, the sheer amount of data can feel like you're trying to drink from a firehose. The secret isn't to track everything; it's to zero in on the handful of metrics that give you a true signal on the health of your system, your app, and ultimately, your customer's experience.
This isn't about becoming a sysadmin overnight. It's about connecting the dots between technical performance and business results. A slow app isn't just an engineering headache—it's a revenue problem. High latency leads to abandoned shopping carts, and a stream of errors shatters the trust you’re working so hard to build. By focusing on a core set of vitals, you can cut through the noise, avoid "alert fatigue," and make sure your team is working on things that actually move the needle.
Let's break these down into three practical categories.
System Health Metrics
Think of these as the basic pulse and blood pressure of your infrastructure. They tell you if the servers powering your application have the resources they need to do their job. If these numbers look bad, everything else you've built on top is standing on shaky ground. These are foundational and often the first indicators of broader problems.
- CPU Utilization: How hard is your server's brain working? If this number is consistently high (say, over 80%), it's a huge red flag. Your server is struggling to keep up, and your users are definitely feeling the slowdown.
- Memory (RAM) Usage: This shows how much of your server's short-term memory is in use. When it gets too full, the system starts using the much slower hard drive as a crutch, and performance absolutely plummets. This is a classic culprit behind a sluggish application.
- Disk I/O and Space: This tracks two things: how fast your system can read and write data, and how much storage you have left. Running out of disk space is one of the few things that can bring your entire application to a dead stop, instantly. Monitoring disk I/O (Input/Output) helps identify slow storage that can become a performance bottleneck.
Application Performance Metrics
If system metrics are the engine's health, then application performance metrics (APM) tell you how well the car is actually driving. These numbers are much closer to the user's reality and are crucial for understanding if your app is reliable and fast. After all, a perfectly healthy server doesn't mean much if the code running on it is inefficient or buggy.
These metrics give you direct, real-world feedback on the code you ship.
High error rates are a direct reflection of application quality. A sudden spike often points to a bad deployment or a failing third-party service, giving you an immediate signal that something is critically wrong and needs attention.
- Error Rate: What percentage of requests are failing with an error (like the dreaded "500 Internal Server Error")? A low, stable error rate is a sign of a well-built, healthy application. Tracking this is non-negotiable.
- Request Rate (Throughput): This is simply how many requests your app is handling per minute or second. It’s essential for understanding your traffic patterns, spotting unusual spikes (which could indicate a DDoS attack or a viral marketing hit), and planning for growth.
- Application Latency (Response Time): How long does your application take to process a request and fire back a response? This is one of the most important metrics, period. High latency translates directly into a slow, frustrating experience for your users. It's crucial to track not just the average, but also percentiles like p95 and p99 to understand the experience of your slowest users.
User Experience Metrics
This is the bottom line. These metrics measure what the user actually sees and feels on their screen. Your customers don't know or care about your CPU utilization—they just care if your website is fast. These front-end metrics are the final report card for your entire stack, translating backend performance into real-world satisfaction.
- Page Load Time: How long does it take for a page to load and become usable for a visitor? This includes metrics like Time to First Byte (TTFB) and Largest Contentful Paint (LCP). Study after study has shown that even a one-second delay can cause people to give up and leave.
- Apdex Score: This is a brilliant, user-focused metric that boils down overall satisfaction into a single score from 0 to 1. It buckets response times into "satisfied," "tolerating," or "frustrated," giving you one simple number to track overall user happiness with your application's responsiveness. It's a great way to communicate performance to non-technical stakeholders.
To make this even more practical, here is a starter pack of essential metrics you should be tracking from day one. This table breaks down what to watch at each layer of your stack.
Essential Monitoring Starter Pack For Your Application
| Category | Key Metric | Why It Matters | Example Tool |
|---|---|---|---|
| System | CPU Utilization | Prevents server overload and application slowdowns. Spikes can indicate inefficient code or insufficient capacity. | Prometheus |
| System | Memory Usage | Running out of memory causes drastic performance degradation. Key for preventing crashes and slowdowns. | Datadog |
| Application | Error Rate (% of 5xx) | Directly measures application stability. A sudden increase is the clearest sign of a critical issue or bad deployment. | Sentry |
| Application | P95/P99 Latency | Measures the response time for the slowest 5% or 1% of users, revealing worst-case performance that average latency hides. | New Relic |
| User Experience | Page Load Time | The ultimate measure of front-end performance. Directly impacts user satisfaction, conversion rates, and bounce rates. | Google Analytics |
| User Experience | Apdex Score | A single, user-centric score that summarizes satisfaction with your application's responsiveness. | Datadog / New Relic |
This isn't an exhaustive list, but it's a powerful starting point. If you have these six metrics dialed in, you'll be ahead of the curve and have a solid grasp on your system's overall health and your users' happiness.
Choosing the Right Monitoring Tools
Okay, so you know what you need to track. The next big question is how you're going to do it. When you start looking at monitoring tools, you'll quickly see there's a huge market out there. But for most startups and small businesses, it really comes down to two main paths: piecing together your own solution with open-source tools, or buying into a commercial, all-in-one platform.
This isn't just a technical choice—it's a business decision. It directly impacts your budget, how your engineers spend their time, and how fast you can actually start getting useful information from your systems. There's no single "best" answer; the right choice depends on your team's size, expertise, budget, and priorities. Let's dig into both approaches so you can figure out which one fits your team.
The Open-Source DIY Approach
The do-it-yourself (DIY) route is a classic for a reason. It’s typically built around a powerhouse combination like Prometheus for gathering metrics and Grafana for creating beautiful dashboards to visualize them. This path gives you ultimate flexibility and total control over your monitoring stack. You can tweak every single dashboard, alert, and data source to match your infrastructure perfectly.
This is a really tempting option for early-stage companies, especially those with strong in-house engineering skills and a tight budget. The software is free, after all, and when you’re watching every dollar, that’s a huge plus. It also avoids vendor lock-in and offers a massive community for support and extensions.
But "free" isn't the same as "no cost." The trade-off for all that control is a serious investment of your team's time. Your engineers will be on the hook for:
- Initial Setup and Configuration: This isn't plug-and-play. They'll have to get all the different components installed, configured, and talking to each other. This includes setting up data collection agents, time-series databases, and visualization layers.
- Ongoing Maintenance: Someone has to manage software updates, security patches, make sure your data storage can keep up with growth, and jump in to fix things when they inevitably break. This is an ongoing operational burden.
- Building Expertise: Your team has to become experts in these tools, and that's time they aren't spending on building the features your customers are paying for. The learning curve can be steep, especially for more advanced configurations.
Commercial SaaS Platforms
On the other side, you have the commercial Software-as-a-Service (SaaS) platforms. Think of tools like Datadog, New Relic, or Splunk. These are built to give you a polished, ready-to-go experience right out of the box. You install an agent on your servers, and within minutes you have professional dashboards, smart alerts, and a single place to see what’s happening across your entire system.
The biggest win here is speed. A SaaS tool helps your team get valuable insights almost immediately, skipping the steep learning curve and maintenance headaches of a DIY setup. They offer integrated solutions for metrics, logs, and traces, often with AI-powered anomaly detection and root cause analysis features. This lets your engineers get back to what they should be doing: shipping new features and improving your product.
Of course, this convenience comes with a monthly bill. These platforms usually charge you based on things like how many servers you’re monitoring or how much data you're sending their way. For a startup that's growing fast, those costs can ramp up quickly. You can get a better feel for the options by checking out our detailed guide to the best infrastructure monitoring tools on the market.
At the end of the day, you're weighing trade-offs. Is the raw power and flexibility of an open-source stack worth the engineering hours, or is a managed SaaS solution the faster path to protecting your revenue and keeping users happy?
This decision circles back to the very foundation of monitoring. It’s no surprise that hardware and wired technologies remain the bedrock for getting accurate data. In 2022, hardware-based monitoring grabbed a 58.8% market share. This stuff matters because systems that aren't watched fail 2-3 times more often. And when they do, 80% of companies say a single infrastructure outage can cost them over $100,000 per hour. You can discover more insights on these market dynamics at Research and Markets. Picking the right tool is your first line of defense.
Building a Monitoring Strategy From Day One
Jumping into infrastructure monitoring can feel like a massive project, but it doesn't have to be. The smartest approaches don't start with a giant, enterprise-grade system. They begin with a simple, practical foundation that grows right alongside your product. For startups and small teams, the goal is always maximum insight for minimum overhead.
You can build an incredibly effective monitoring strategy by taking it one step at a time. This phased approach lets you keep your energy focused on shipping features and making users happy, all while knowing your infrastructure won't crumble under your success. The secret is to start small, iterate, and add layers of visibility as you scale.
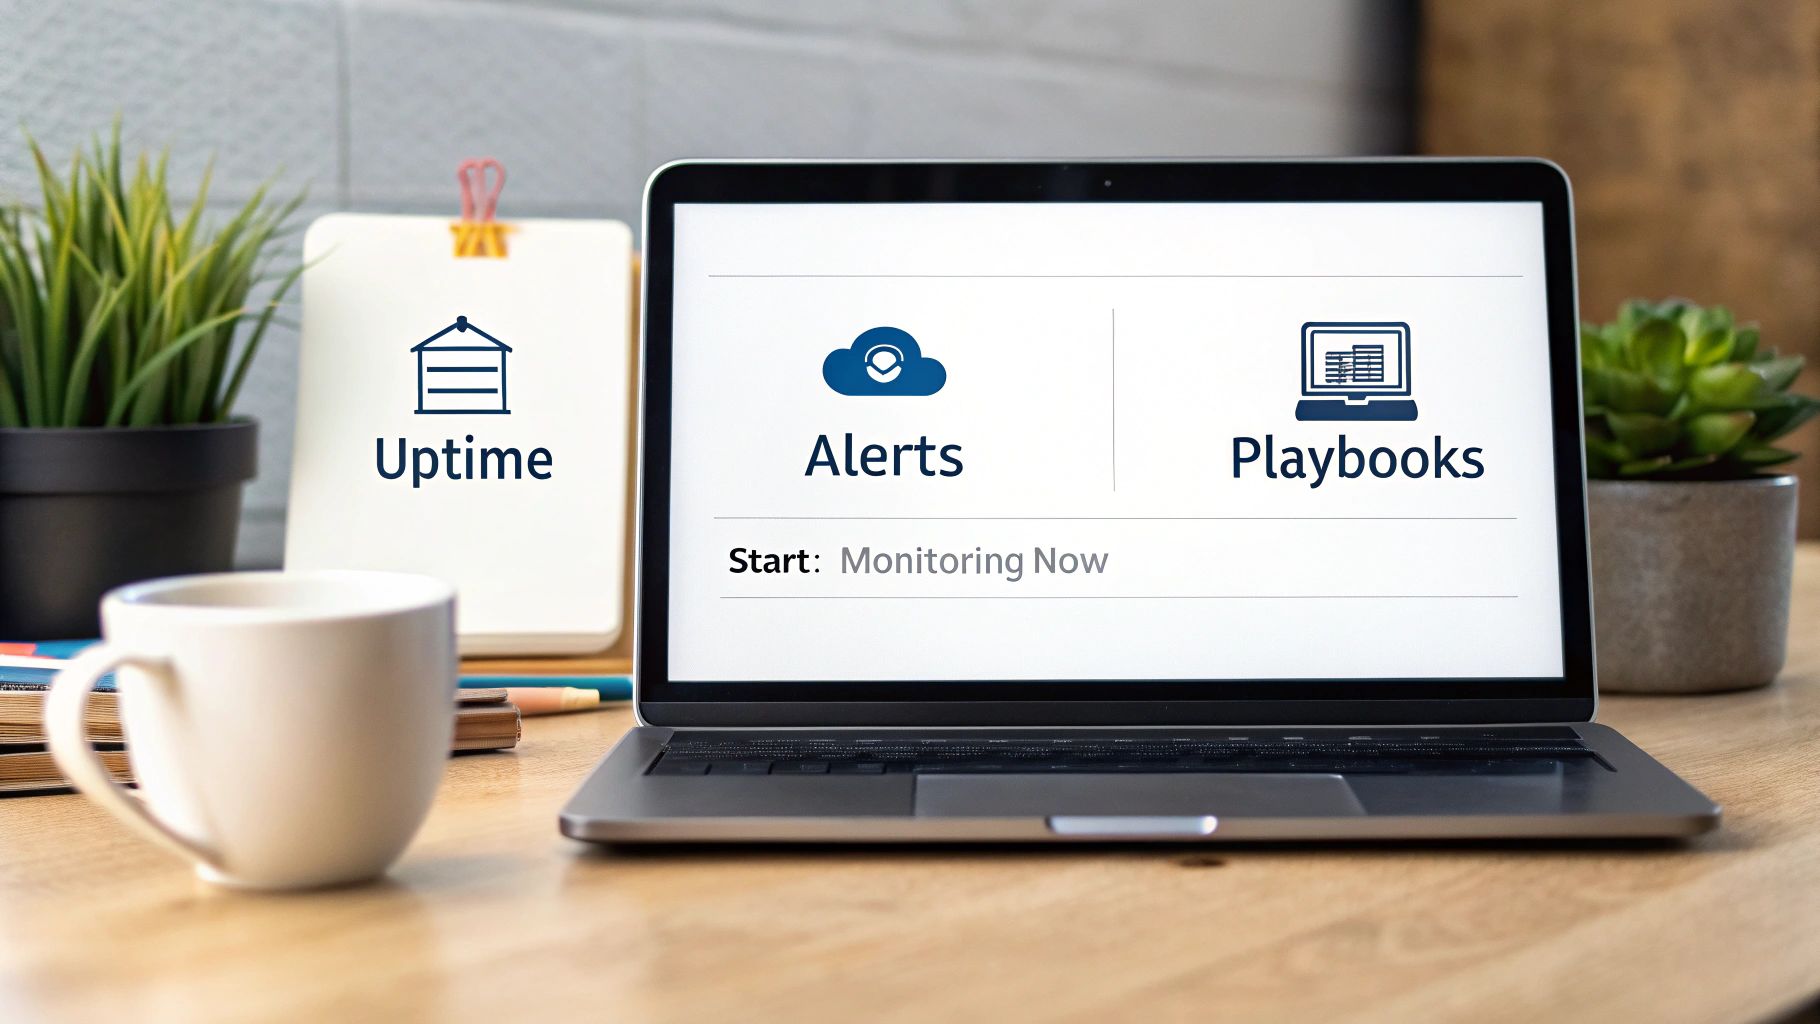
Phase 1: Start with Simple Uptime Checks
Before you do anything else, you need to answer the most fundamental question in monitoring: "Is my application online?" This is the simplest, yet most critical, check you can run. It acts as your ultimate safety net.
Set up an external service to ping your website or a key API endpoint every minute from multiple geographic locations. If it doesn't get a good response back, you get an alert. That's it. This is your first line of defense against a complete outage, and it literally takes minutes to configure. This tells you immediately if your entire service is unreachable by the outside world.
Phase 2: Instrument Your Application
Once you know you're online, the next question is, "What's actually happening inside the app?" This is where you instrument your code to send out custom metrics. The trick here is to focus on numbers that directly tie to business value and what your users are experiencing. These are often called Key Performance Indicators (KPIs).
Start with the basics that matter most to your business model:
- User Sign-ups: Are people successfully creating accounts?
- Completed Orders: Is money coming in? A dip here is a critical business issue.
- Failed Payments: Where are transactions breaking down? Is it a specific gateway or card type?
- Search Queries Performed: Is a core feature of your app functioning as expected?
These metrics give you a direct line of sight from infrastructure health to business outcomes. A sudden nosedive in completed orders is a much clearer signal of trouble than a minor CPU spike will ever be.
Phase 3: Define Meaningful Alerts
Alerts are your system's smoke detectors. But just like a smoke detector that goes off every time you make toast, too many false alarms will just teach your team to ignore them. This phenomenon, known as "alert fatigue," is a serious problem. The secret to great alerting is to be incredibly selective. Don't fire off an alert for every little metric that wiggles; create them only for problems that need a human to step in.
A great alert is both urgent and actionable. When an alert fires, the person on call should know exactly why it matters and have a solid idea of what to do next. This is how you prevent alert fatigue and keep your team focused on what's real.
For example, forget alerting when CPU usage hits 70%. That might be normal under heavy load. Instead, set an alert for when your P99 latency—the response time for your slowest 1% of users—goes above a painful threshold for three straight minutes. Now that's a real problem affecting real people.
Phase 4: Create Simple Runbooks
An alert tells you something's broken; a runbook tells you how to fix it. A runbook (or playbook) is just a simple checklist of steps to diagnose and resolve a specific alert. You don’t need a fifty-page manual for every possible failure scenario. A simple, clear document is far more effective during a stressful outage.
Start with your most important alerts. A barebones runbook might look something like this:
- Alert: Database CPU has been over 90% for 5 minutes.
- Step 1: Check for long-running queries in the database dashboard. Link to the dashboard.
- Step 2: If a bad query is identified, terminate it using this command:
[command]. - Step 3: Escalate to the on-call developer if the problem continues. Contact info:
@developer-on-call. - Step 4: Document the incident resolution in the post-mortem channel.
This straightforward process can turn a stressful, chaotic incident into a structured, calm response. By building out your monitoring strategy in these manageable stages, you create a powerful foundation for reliability without ever slowing down your core product development.
Frequently Asked Questions
Now that we’ve walked through the fundamentals of infrastructure monitoring, you probably have a few practical questions bouncing around your head. This is totally normal, especially for founders and teams who are just getting their feet wet. Let's dig into some of the most common ones.
How Much Should I Budget for Monitoring?
This is the million-dollar question, but thankfully the answer isn't a million dollars. A solid rule of thumb is to set aside 5% to 10% of your total infrastructure budget for your monitoring stack—that includes both the tools and the people who manage them.
If you're an early-stage startup, you can often get started for free. Many SaaS providers have generous free tiers, and open-source tools are always an option. Just remember, as you grow, the "cost" isn't just the monthly subscription. You also have to account for the engineering hours it takes to set up, maintain, and get real value from your dashboards. Think of it not as an expense, but as an investment in keeping your customers happy and protecting your revenue.
Is Our Monitoring Data Secure?
It’s a great question, and the answer is a firm yes. Reputable monitoring platforms are built with security at their core. The agents you install on your servers use encrypted connections (like TLS) to send data back to a secure cloud backend, so your metrics and logs are protected in transit.
On top of that, these platforms come with strong access controls. You can get really granular about who on your team can see what, or who has permission to change alerting rules. It's always smart to operate on the principle of least privilege—only give people the access they absolutely need to do their job. Be mindful not to log sensitive user data like passwords or credit card numbers. Modern tools often have features to help you scrub this kind of information automatically.
The goal is to make data accessible for troubleshooting without exposing sensitive information. Modern tools are built with security as a core feature, not an afterthought.
What's the Easiest Way to Get Started?
Don't overcomplicate it. The absolute simplest first step is to set up an external uptime monitor. A tool like UptimeRobot or Freshping can be configured in less than five minutes. It’ll just ping your website from different places around the world and alert you if it goes down. Bam—instant safety net.
Once you have that, your next move is to sign up for a free trial with an all-in-one SaaS tool. Most have fantastic onboarding guides that will help you install an agent and see your first real metrics—like CPU and memory usage—pop up on a dashboard in under an hour. This will give you immediate visibility with minimal effort. Start there. Get comfortable with the basics, and then expand your monitoring strategy as your application and team grow.
Ready to turn your ambitious ideas into production-ready products without the operational headaches? Vibe Connect combines AI-powered code analysis with a team of seasoned experts to manage deployment, scaling, and security for you. We bake in observability from day one, so you can focus on your vision while we ensure your infrastructure is fast, reliable, and secure. Accelerate your journey from idea to impact today.