
In today's competitive landscape, slow is the new down. User expectations are higher than ever, and a single performance hiccup can lead to lost revenue and a damaged reputation. But how do you find the root cause of a slowdown in a complex, distributed system? The answer lies in effective Application Performance Monitoring (APM). Identifying the right application performance monitoring tools is critical, as they provide the deep visibility needed to diagnose issues before they impact your users. This is not just a technical requirement; it's a core business imperative for maintaining user satisfaction and driving growth in an increasingly digital world.
This guide moves beyond generic marketing claims to provide a detailed, real-world comparison of the 12 best application performance monitoring tools available today. We cut through the noise to analyze each platform’s unique strengths, ideal use cases, and critical limitations. Whether you're a startup founder managing an MVP or a tech lead at a growing company, this resource is designed to help you make an informed decision without sifting through countless websites. It serves as a comprehensive resource for anyone tasked with ensuring application reliability and performance.
Inside, you will find:
- A head-to-head analysis of top-tier solutions like Datadog, New Relic, and Dynatrace.
- Specific scenarios where open-source-driven platforms like Grafana or specialized tools like Sentry excel.
- Practical considerations for integrating with cloud-native services from AWS, Azure, and Google Cloud.
Each review includes direct links and screenshots to give you a clear view of the user experience. We'll also explore how Vibe Connect’s on-demand observability and performance-tuning services can complement your chosen APM strategy, providing the specialized expertise needed to resolve complex bugs, refactor code, and optimize your deployments. Let's dive in and find the perfect APM tool to ensure your application is fast, reliable, and scalable.
1. Datadog APM
Datadog is a dominant force in the cloud observability space, and its APM product is a core pillar of its unified platform. It excels at providing end-to-end distributed tracing for complex, modern architectures like microservices and serverless functions. The platform automatically discovers services and maps their dependencies, giving engineering teams a clear, interactive visualization of how requests flow through their entire stack. This automatic discovery is a significant time-saver, eliminating the need for manual configuration and ensuring that the visibility map is always up-to-date as the architecture evolves.
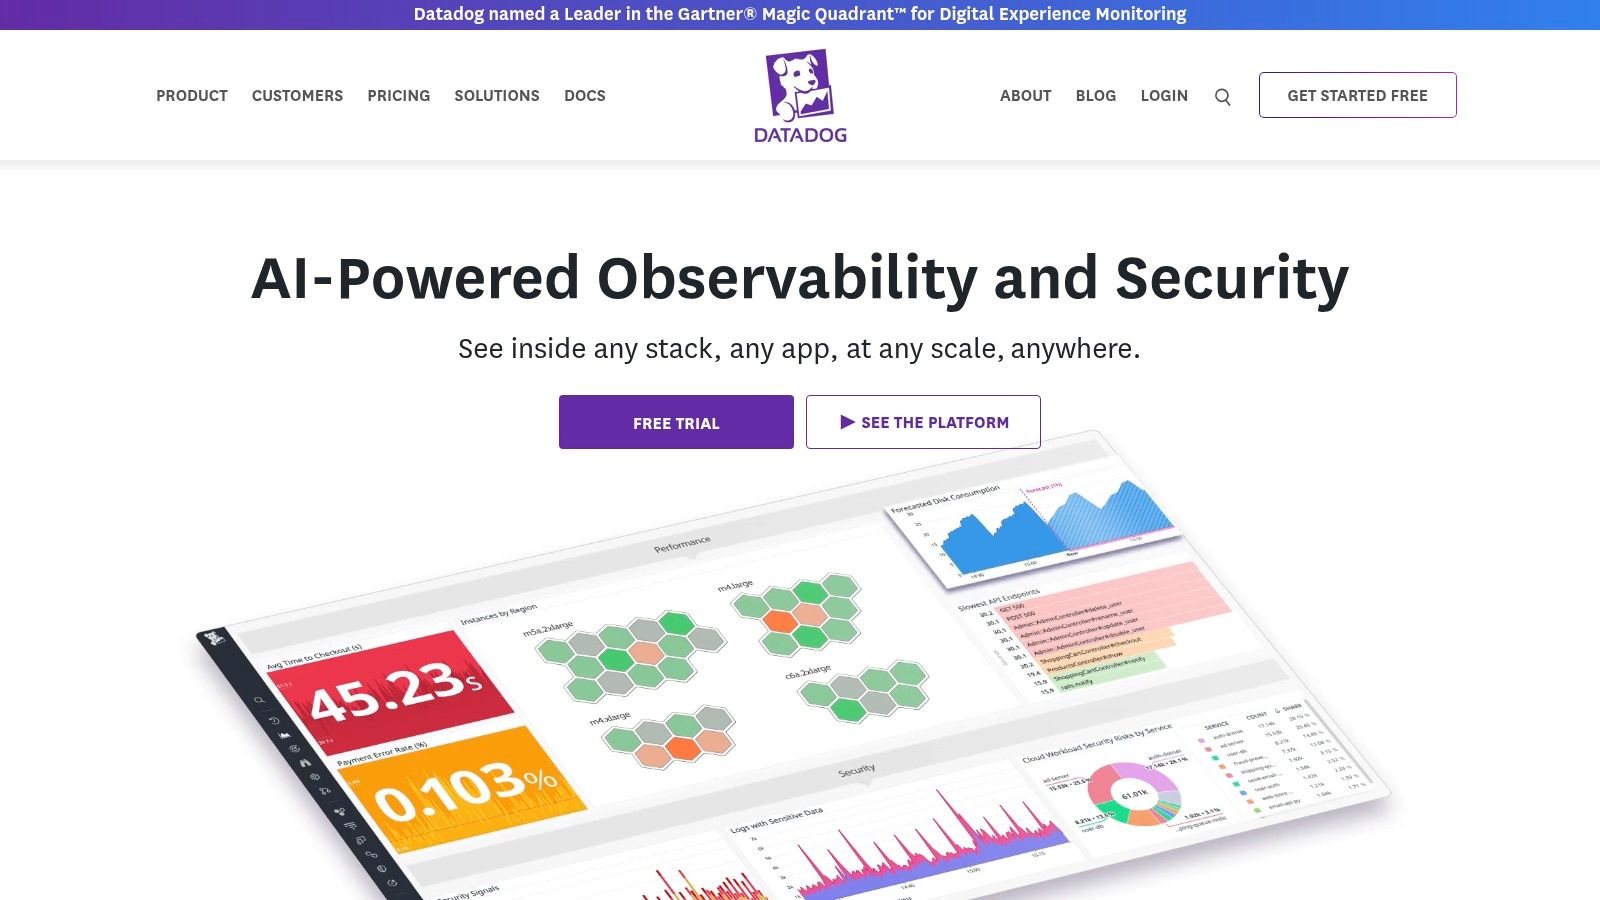
What sets Datadog apart is its powerful cross-product correlation. A single click can take you from a slow trace to related infrastructure metrics, logs, and even code-level performance insights via its Continuous Profiler. This tight integration significantly reduces the mean time to resolution (MTTR) by eliminating the need to manually cross-reference data across disparate tools. This focus on unified visibility is critical for ensuring your systems are truly production-ready; a concept you can explore further with a comprehensive production readiness checklist. For DevOps teams, this unified view streamlines workflows and fosters collaboration between development and operations.
Key Considerations
Datadog's strength is also a point of caution: its sheer depth and breadth can present a steep learning curve for new teams. The cost, while predictable with host-based pricing, can also escalate quickly as you add more products or ingest high volumes of custom metrics and logs. Effective cost management requires careful planning and regular review of data ingestion patterns to ensure you're only paying for the data that provides real value.
| Feature Area | Details |
|---|---|
| Ideal Use Case | Cloud-native companies with microservices or serverless architectures. |
| Key Differentiator | Seamless correlation between traces, metrics, logs, and security signals. |
| Pricing Model | Per-host, per-month billing with optional add-ons for profiling, RUM, etc. |
| Implementation | Agent-based; requires installing the Datadog Agent on hosts/containers. |
- Pros: Extensive language and framework support, mature ecosystem, excellent documentation.
- Cons: Can become expensive at scale, feature-rich UI can be overwhelming initially.
Learn more at: https://www.datadoghq.com
2. New Relic
New Relic has established itself as a pioneer in the APM space, offering a comprehensive, full-stack observability platform. It is designed to be an all-in-one solution, providing visibility across applications, infrastructure, logs, and user experiences from a single pane of glass. The platform’s strength lies in its guided onboarding and default dashboards, which allow teams to get up and running quickly and start identifying performance bottlenecks with minimal configuration. This ease of setup makes it particularly appealing for teams that need to demonstrate value quickly without a prolonged implementation cycle.
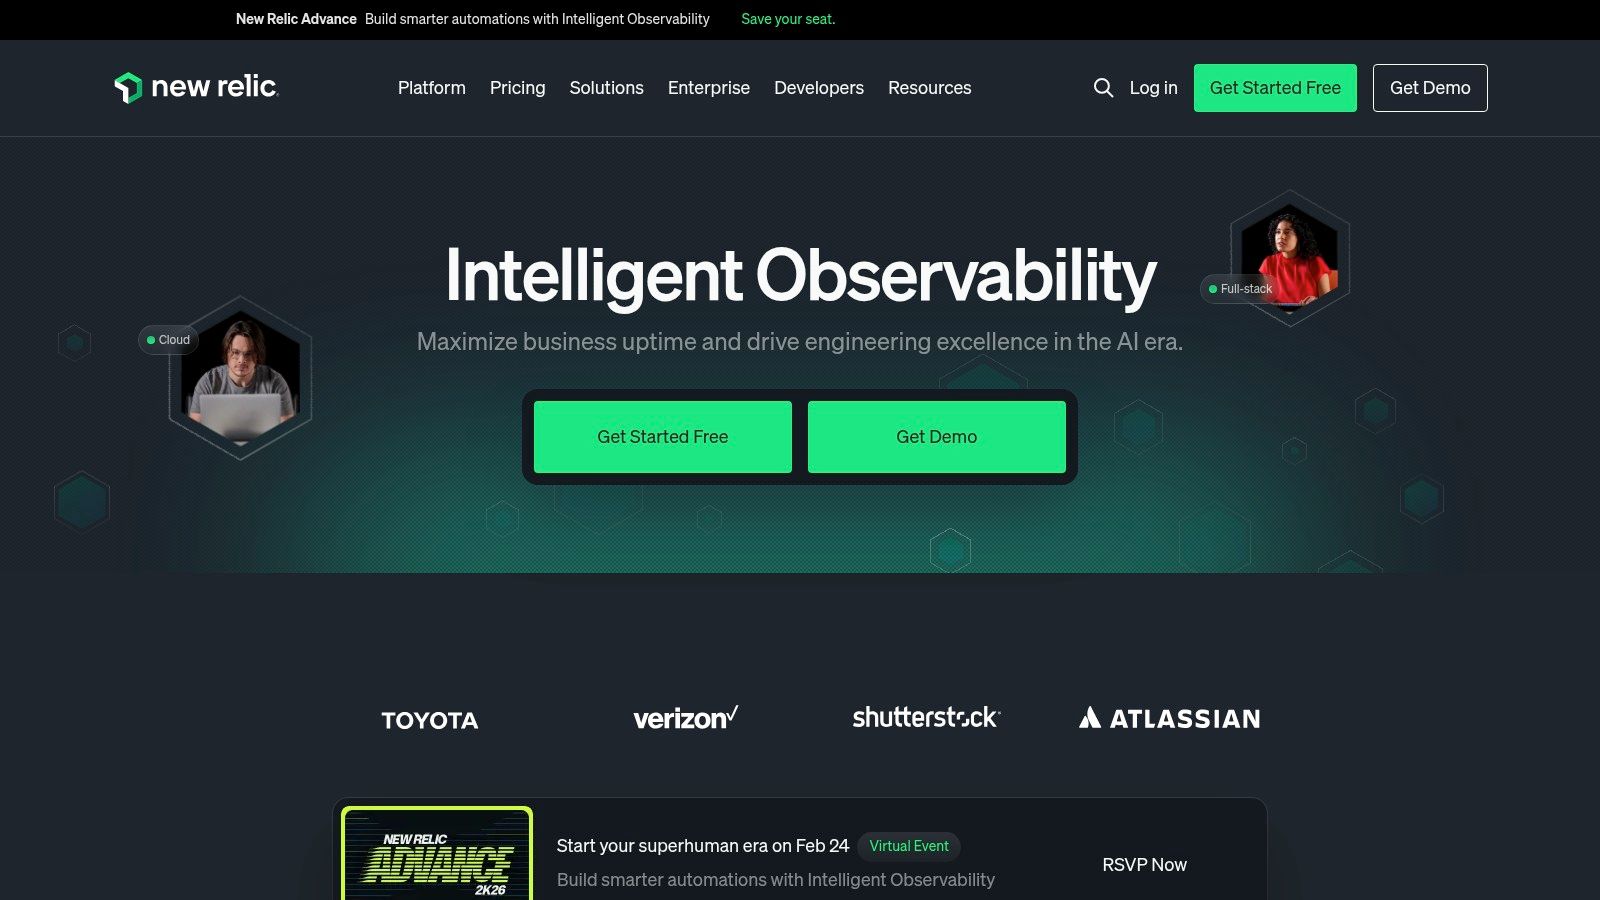
What makes New Relic particularly attractive is its generous free tier and transparent, usage-based pricing model. This approach significantly lowers the barrier to entry for smaller teams and startups looking to implement robust monitoring without a hefty upfront investment. By providing a full-featured platform for free up to 100 GB of data ingest per month, it empowers early-stage companies to adopt best practices from day one. This aligns well with the lean operational principles crucial for success, a core tenet of effective DevOps for startups.
Key Considerations
While the usage-based model is a key benefit, it also requires diligent governance. Costs can escalate unexpectedly if data ingestion is not carefully monitored and managed. As your needs grow, accessing more advanced features for deep analysis or enhanced security may require upgrading to a paid plan like Data Plus, which should be factored into long-term budget planning. It's crucial for teams to set up alerts on data consumption to avoid budget surprises at the end of the month.
| Feature Area | Details |
|---|---|
| Ideal Use Case | Startups and SMBs needing a powerful, low-cost entry point to observability. |
| Key Differentiator | A generous free tier with a unified platform and clear, usage-based billing. |
| Pricing Model | Usage-based on data ingest and users, with a substantial free tier. |
| Implementation | Agent-based; requires installing language-specific agents in your services. |
- Pros: Excellent for startups via free 100 GB/month ingest, good default dashboards and guided onboarding.
- Cons: Costs can scale with data ingest, requiring careful governance; advanced features may require paid tiers.
Learn more at: https://newrelic.com
3. Dynatrace
Dynatrace positions itself as a leader in AI-powered, full-stack observability, designed for complex enterprise environments. Its core strength lies in automation and causation analysis. The platform's OneAgent technology automatically discovers all components of an application stack, from infrastructure to code-level processes, and maps their dependencies in its dynamic Smartscape visualization. This provides immediate context for any performance issue, which is invaluable in microservices architectures where dependencies are numerous and constantly changing.

What truly sets Dynatrace apart is its Davis AI engine, which goes beyond simple correlation to provide deterministic root-cause analysis. It automatically identifies the precise source of problems, reducing alert noise and saving engineers from manual troubleshooting. This level of automation is crucial for maintaining system stability and is a key component of a successful zero-downtime deployment strategy. The platform's Grail data lakehouse architecture also enables powerful, context-rich analytics on massive datasets, allowing for deeper insights into long-term performance trends.
Key Considerations
Dynatrace is a comprehensive, enterprise-grade solution. This means its powerful, all-in-one approach might be excessive for smaller applications or early-stage startups. The granular, consumption-based pricing model offers flexibility but requires careful monitoring and planning to manage costs effectively, especially as you enable more capabilities like RUM, synthetics, and security monitoring. Potential users should conduct a thorough cost-benefit analysis before committing to the platform.
| Feature Area | Details |
|---|---|
| Ideal Use Case | Large enterprises with hybrid-cloud environments seeking automated root-cause analysis. |
| Key Differentiator | Davis AI for deterministic root-cause analysis and Smartscape dependency mapping. |
| Pricing Model | Consumption-based; charges for hosts, services, RUM sessions, synthetic monitors, etc. |
| Implementation | Agent-based (OneAgent) for automatic full-stack discovery and instrumentation. |
- Pros: Powerful AI correlation and topology mapping, extensive automation reduces manual effort.
- Cons: Enterprise-grade scope can be overkill for very small apps, broad pricing model requires upfront planning.
Learn more at: https://www.dynatrace.com
4. Cisco AppDynamics
Cisco AppDynamics stands out among application performance monitoring tools by focusing intensely on the business impact of application behavior. It excels at mapping user-initiated "Business Transactions" to the underlying infrastructure, code, and database calls that support them. This approach allows teams to prioritize performance issues based on their direct effect on revenue, user experience, and key business metrics, making it a powerful tool for enterprise environments. This linkage is critical for communicating the value of engineering efforts to business stakeholders in a language they understand.
AppDynamics provides deep, code-level diagnostics and automatically discovers application topologies, offering a clear view of service dependencies. Its platform is particularly strong in monitoring complex, distributed systems, including specialized environments like SAP. This business-centric view helps bridge the gap between technical performance data and executive-level business outcomes, ensuring that engineering efforts are aligned with strategic goals. The platform is designed to connect performance directly to business analytics, turning raw data into actionable business intelligence.
Key Considerations
AppDynamics' strength lies in its business transaction monitoring, which is ideal for large, established enterprises. However, its pricing model, based on CPU cores, can be less cost-effective for highly dynamic, containerized, or serverless workloads where core counts fluctuate unpredictably. The user interface, while comprehensive, may feel more complex for smaller teams not requiring its full suite of enterprise features. This makes it less suitable for agile, cloud-native startups that prioritize simplicity and flexibility.
| Feature Area | Details |
|---|---|
| Ideal Use Case | Large enterprises needing to correlate application performance with business KPIs. |
| Key Differentiator | Business transaction monitoring that maps performance to business outcomes. |
| Pricing Model | Per-CPU-core licensing, with add-ons for RUM, security, and synthetics. |
| Implementation | Agent-based instrumentation for supported languages and frameworks. |
- Pros: Strong enterprise and SAP visibility, straightforward per-CPU-core pricing.
- Cons: CPU-core pricing may not suit modern cloud architectures, UI can feel heavy for smaller teams.
Learn more at: https://www.appdynamics.com
5. Elastic Observability (Elastic APM)
Elastic Observability extends the power of the renowned Elasticsearch search engine into the realm of APM, offering a unified platform for logs, metrics, and traces. Its strength lies in its incredible flexibility and cost-effectiveness at scale, especially for teams already invested in the Elastic Stack (ELK). By leveraging a powerful search and analytics foundation, it allows developers to slice and dice performance data with remarkable speed and granularity. This power is particularly useful for ad-hoc investigations and deep-dive analysis that go beyond standard dashboards.
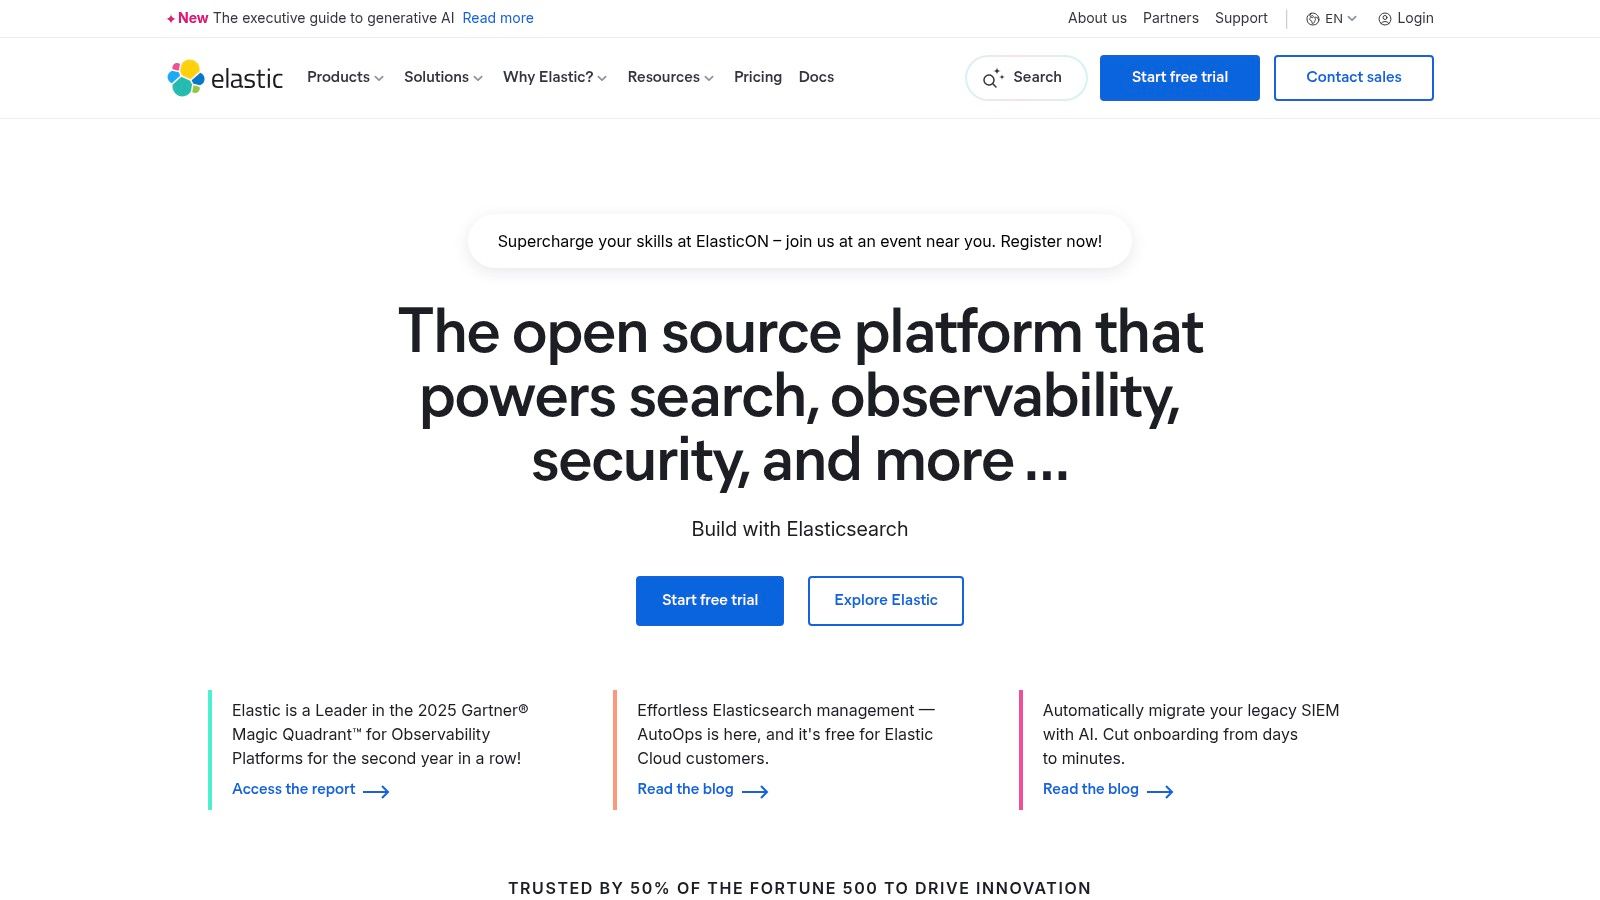
The platform is a strong contender among application performance monitoring tools due to its deployment versatility, offering serverless, hosted, or self-managed options to fit any operational model. It is also strongly aligned with open standards, providing first-class support for OpenTelemetry. Features like tail-based sampling, SLO monitoring, and machine learning-driven anomaly detection are built-in, providing advanced capabilities without relying on third-party integrations. This open-standards alignment future-proofs instrumentation efforts and prevents vendor lock-in.
Key Considerations
Elastic's primary advantage is its resource-based pricing, which is based on data ingest and retention rather than hosts or users. This can lead to significant cost savings but requires active governance to manage data volumes effectively. Furthermore, mastering the full potential of the stack, including its powerful Kibana Query Language (KQL), involves a learning curve for teams new to the ecosystem. Investment in training may be necessary to fully unlock the platform's capabilities.
| Feature Area | Details |
|---|---|
| Ideal Use Case | Organizations with large data volumes or existing ELK Stack deployments. |
| Key Differentiator | Ingest-based pricing and flexible deployment (cloud, self-hosted, hybrid). |
| Pricing Model | Resource-based (data ingest, retention, compute) rather than per-host. |
| Implementation | OpenTelemetry-native or via Elastic APM agents for various languages. |
- Pros: Very cost-efficient at scale with ingest-based pricing, flexible deployment options to fit different operational models.
- Cons: Powerful query model (KQL) and stack concepts require ramp-up, cost control requires active ingest/retention governance.
Learn more at: https://www.elastic.co
6. Sentry (Performance Monitoring and Tracing)
Sentry has carved out a unique space in the world of application performance monitoring tools by starting with a developer-first, code-level focus. Originally known for its best-in-class error tracking, it has expanded into a robust performance monitoring solution that tightly integrates with developer workflows. It excels at connecting poor performance directly to code-level issues, such as slow database queries or API calls, and linking them to specific commits and releases. This direct link from problem to code is a game-changer for developer productivity.
What makes Sentry a go-to for many startups and development teams is its highly actionable nature. The platform doesn't just show you a slow trace; it groups related issues, identifies suspects through Git integration, and makes it easy to assign the problem to the right developer. This issue-oriented workflow streamlines the debugging process, moving from performance anomaly to code fix much faster than traditional tools. Its approachable pricing and strong focus on application health make it an excellent entry point into APM, especially for front-end and mobile application monitoring.
Key Considerations
Sentry's primary strength is application-level monitoring; it provides less visibility into underlying infrastructure compared to full-stack observability platforms. While its pay-as-you-go model for high-volume events is flexible, teams with extremely high traffic or complex distributed systems might find costs escalating if they don't carefully manage event consumption and sampling rates. It's best used in conjunction with an infrastructure monitoring tool for complete visibility.
| Feature Area | Details |
|---|---|
| Ideal Use Case | Startups and dev teams needing to connect application errors with performance bottlenecks. |
| Key Differentiator | Strong focus on developer workflow, error-to-code traceability, and Git integration. |
| Pricing Model | Tiered plans with event quotas; pay-as-you-go options for additional usage and features. |
| Implementation | SDK-based; requires integrating the Sentry SDK into your application code. |
- Pros: Very approachable for indie developers and startups, clear, low-entry pricing and strong Git/CI integrations.
- Cons: Best suited for app-level performance; limited infrastructure coverage vs full observability suites, high event/span volumes can raise costs.
Learn more at: https://sentry.io
7. Splunk Observability Cloud
Splunk is a giant in the big data and logging space, and its Observability Cloud leverages this heritage by combining high-throughput metrics, enterprise-grade logging, and powerful tracing into a unified platform. Originally built on the SignalFx acquisition, it is particularly well-suited for complex, high-volume environments where managing massive data streams is a daily reality. The platform excels at providing clear service maps and deep metric sets that help teams understand dependencies and pinpoint bottlenecks in distributed systems. Its pedigree in handling large-scale data makes it a trusted choice for large enterprises.
What distinguishes Splunk is its flexible approach to deployment and pricing, catering to both traditional and cloud-native architectures. It offers host-based subscriptions that include container allocations for predictable budgeting, alongside usage-based options ideal for dynamic serverless or cloud service workloads. This adaptability, combined with multi-region support for data residency and latency requirements, makes it a strong contender for global enterprises with stringent compliance needs. Splunk provides some of the most robust application performance monitoring tools for organizations operating at a significant scale, especially in regulated industries.
Key Considerations
Splunk’s power can also be its primary challenge. Navigating its pricing models requires careful planning, as the public-facing pages emphasize the structure over specific list prices, often necessitating a sales conversation to get a precise quote. For organizations with complex estates, diligent capacity management is essential to control costs and ensure you are leveraging the right entitlements for your specific usage patterns. This lack of pricing transparency can be a barrier for smaller organizations.
| Feature Area | Details |
|---|---|
| Ideal Use Case | Large enterprises with high-throughput systems and strict compliance needs. |
| Key Differentiator | Dual pricing models (host-based and usage-based) and multi-region support. |
| Pricing Model | Flexible host-based subscriptions or usage-based pricing; requires sales contact. |
| Implementation | Agent-based via the Splunk OpenTelemetry Collector. |
- Pros: Mature platform built for scale, strong service maps, choice between predictable and flexible pricing.
- Cons: Pricing is not transparent and often requires a sales engagement, complex to manage entitlements at scale.
Learn more at: https://www.splunk.com
8. Grafana Cloud
Grafana Cloud leverages its powerhouse status in open-source visualization to offer a comprehensive, managed observability stack. Built on community-driven projects like Loki for logs, Tempo for traces, and Mimir for metrics, it provides a unified platform that strongly appeals to teams committed to open standards. Its Application Observability module streamlines the process of correlating signals, making it one of the more accessible open-standards application performance monitoring tools. This commitment to the open-source ecosystem resonates with developers who value transparency and community support.
What makes Grafana Cloud stand out is its commitment to an OpenTelemetry-first ingestion strategy, which significantly reduces the risk of vendor lock-in. This approach allows engineering teams to instrument their code once and send telemetry data to any compatible backend. Combined with its transparent, usage-based pricing and a generous free tier, Grafana Cloud presents a compelling option for startups and enterprises alike who prioritize flexibility and cost control without sacrificing powerful features. This flexibility is a major strategic advantage in a fast-changing technology landscape.
Key Considerations
Grafana's primary strength is its foundation in open-source tooling, but this can also introduce a learning curve for teams not already familiar with the concepts behind Prometheus, Loki, or Tempo. While the managed service handles the operational overhead, effectively leveraging the platform's full potential often benefits from an understanding of its underlying components. Some advanced enterprise features and plugins also come as paid add-ons, which should be factored into the total cost of ownership.
| Feature Area | Details |
|---|---|
| Ideal Use Case | Teams wanting to avoid vendor lock-in with an OpenTelemetry-based stack. |
| Key Differentiator | A fully managed observability platform built on popular open-source projects. |
| Pricing Model | Usage-based (per GB/series) with a generous free tier and per-host options. |
| Implementation | OpenTelemetry-native; supports various agents and direct instrumentation. |
- Pros: Transparent, granular pricing and a friendly free tier, open-standards tooling reduces vendor lock-in.
- Cons: Some enterprise plugins and features are paid add-ons, open-source concepts may require familiarity to operate effectively.
Learn more at: https://grafana.com
9. AWS X‑Ray
For teams deeply embedded within the Amazon Web Services ecosystem, AWS X-Ray offers a native, low-friction solution for distributed tracing. It is designed to analyze and debug production, distributed applications, such as those built using a microservices architecture. X-Ray provides an end-to-end view of requests as they travel through your application, helping you identify and troubleshoot the root cause of performance issues and errors. Its seamless integration with AWS services makes it the path of least resistance for many AWS users.
The primary advantage of AWS X-Ray is its seamless integration with other AWS services like EC2, Lambda, and Elastic Beanstalk. It simplifies the process of gaining visibility into call chains and service dependencies without the overhead of configuring a complex third-party agent. This makes it an excellent starting point for teams looking to adopt application performance monitoring tools with minimal initial investment and setup complexity, especially when their entire stack resides on AWS. This deep integration also simplifies permission management through standard IAM roles.
Key Considerations
While X-Ray is powerful for AWS-native environments, its feature set is more focused on tracing compared to the broader observability suites of dedicated third-party platforms. Achieving comprehensive cross-cloud visibility or incorporating advanced monitoring features often requires integrating X-Ray data with other tools, like Amazon CloudWatch or an OpenTelemetry collector, which can add complexity. It's an excellent tool for AWS-specific tracing but may not suffice as a complete, multi-cloud observability solution on its own.
| Feature Area | Details |
|---|---|
| Ideal Use Case | Teams with applications built entirely on the AWS cloud. |
| Key Differentiator | Native, low-friction integration with the AWS service ecosystem. |
| Pricing Model | Per-trace, pay-as-you-go model with a generous permanent free tier. |
| Implementation | SDK-based instrumentation for your code and agent for host-level services. |
- Pros: Lowest-friction option for AWS-centric applications, highly cost-effective at modest volumes.
- Cons: Less feature-rich than dedicated third-party observability suites, cross-cloud visibility requires additional setup and tooling.
Learn more at: https://aws.amazon.com/xray
10. Azure Application Insights (Azure Monitor)
Azure Application Insights is Microsoft's native APM solution, deeply integrated within the broader Azure Monitor ecosystem. It is the default choice for organizations heavily invested in the Azure cloud, providing powerful diagnostics and analytics for applications built on Azure services. Its core strength lies in automatically detecting performance anomalies and providing a rich, interactive application map to visualize dependencies between components. This native integration provides a coherent user experience for teams already working within the Azure portal.
What makes Application Insights a standout among application performance monitoring tools is its seamless connection with Log Analytics. Telemetry data is ingested into a Log Analytics workspace, allowing engineers to run powerful, ad-hoc queries using the Kusto Query Language (KQL). This provides immense flexibility for custom dashboarding, complex alerting, and deep-dive analysis that goes beyond pre-built APM views. The platform also offers availability tests for synthetic monitoring and tight integrations with Azure DevOps for a connected CI/CD feedback loop.
Key Considerations
The platform's deep integration with the Azure ecosystem is both its greatest strength and a potential drawback. Teams not already familiar with Azure concepts like Log Analytics, KQL, and resource groups may face a significant learning curve. Furthermore, the pay-as-you-go pricing model for data ingestion and retention requires careful management and budgeting to prevent unexpected cost overruns at scale. Organizations must actively monitor their data ingestion and set spending limits to control costs effectively.
| Feature Area | Details |
|---|---|
| Ideal Use Case | Organizations with applications and infrastructure hosted primarily on Azure. |
| Key Differentiator | Native integration with Azure Monitor and powerful KQL-based analytics. |
| Pricing Model | Pay-as-you-go per GB ingested, with commitment tiers for cost savings. |
| Implementation | SDK instrumentation or auto-instrumentation for supported Azure services. |
- Pros: Unbeatable integration for Azure-hosted apps, strong governance and RBAC features, leverages powerful Log Analytics backend.
- Cons: Cost can be difficult to predict without strict quotas, feature set is heavily tied to the Azure ecosystem.
Learn more at: https://azure.microsoft.com/services/application-insights/
11. Google Cloud Operations (Cloud Trace, Logging, Monitoring)
For teams deeply embedded in the Google Cloud Platform (GCP) ecosystem, the native suite of observability tools, now part of Google Cloud Operations, offers an integrated and cost-effective solution. The suite includes Cloud Trace, Logging, Monitoring, Error Reporting, and Profiler, which work together to provide visibility into applications running on GCP and hybrid environments. It stands out by leveraging tight integration with services like Google Kubernetes Engine (GKE) and native support for Prometheus metrics, making it a natural choice for modern, containerized workloads on GCP.
The primary advantage of this suite is its incredibly low cost of entry, particularly for tracing. Cloud Trace offers a substantial free monthly allotment of spans, with subsequent usage billed on a per-span basis, making it one of the most economical application performance monitoring tools for startups and high-volume systems. This native integration also simplifies security and administration, as permissions are managed through standard GCP IAM roles and resources are organized using familiar project labels, reducing the operational overhead for platform teams.
Key Considerations
While powerful within its native environment, achieving comprehensive cross-cloud visibility often requires augmenting the suite with other tools. The user experience can also feel fragmented, as functionality is spread across several distinct product interfaces (Trace, Logging, Monitoring) rather than presented in a single, unified view. This can lead to a disjointed workflow when troubleshooting complex issues that span multiple observability pillars, requiring users to switch between different UIs.
| Feature Area | Details |
|---|---|
| Ideal Use Case | Organizations primarily operating on GCP, especially those using GKE. |
| Key Differentiator | Extremely low tracing costs and seamless integration with GCP services and IAM. |
| Pricing Model | Per-span pricing for Trace with a large free tier; other services are volume-based. |
| Implementation | Native instrumentation for GCP services; supports OpenTelemetry for broader use. |
- Pros: Very low tracing cost with generous free tier, clean integration with GCP IAM, labeling, and billing.
- Cons: Cross-cloud visibility requires additional tooling, UI and features are split across products which can feel fragmented.
Learn more at: https://cloud.google.com/products/operations
12. IBM Instana Observability
IBM Instana Observability is an enterprise-grade platform that prioritizes automation and high-fidelity data. It automatically discovers all services and their dependencies, creating a dynamic topology map that updates in real time. Its key strength is the one-second data granularity, providing extremely detailed performance insights that can pinpoint transient issues often missed by other application performance monitoring tools. This makes it ideal for highly dynamic environments like Kubernetes and microservices, where conditions change rapidly and low-frequency sampling can miss critical events.
What sets Instana apart is its AI-powered root-cause analysis, which correlates events across the full stack to identify the precise origin of an issue with minimal human intervention. The platform's unified agent approach simplifies deployment, and its predictable pricing model, based on Monitoring Value Units (MVS), allows for unlimited users and applications. This structure is designed to avoid the cost surprises that can occur with usage-based billing, making it a strong contender for large or complex estates where budget predictability is paramount for financial planning.
Key Considerations
Instana’s strength lies in its comprehensive, automated approach for complex systems. However, its pricing model, while predictable, includes minimums that may not be cost-effective for very small-scale applications or individual developers. Additionally, while the core platform is extensive, some advanced capabilities like managed synthetic points of presence are billed as separate add-ons. Prospective customers should clarify the full cost of all required features to avoid unexpected expenses down the line.
| Feature Area | Details |
|---|---|
| Ideal Use Case | Large enterprises with complex, containerized, or hybrid-cloud environments. |
| Key Differentiator | Fully automated discovery and dependency mapping with one-second granularity. |
| Pricing Model | Per-MVS (Monitoring Value Unit) with Essentials and Standard tiers; predictable licensing. |
| Implementation | A single, unified agent for automated deployment and data collection; OpenTelemetry supported. |
- Pros: Rich automation and topology mapping, simple and predictable pricing, unlimited users and applications per license.
- Cons: MVS model may not fit very small applications, some advanced features are separate add-ons.
Learn more at: https://www.ibm.com/instana
12 APM Tools — Side-by-Side Comparison
| Product | Core strengths ✨ | UX & Reliability ★ | Pricing & Value 💰 | Best for 👥 | Unique edge / Vibe fit 🏆 |
|---|---|---|---|---|---|
| Datadog APM | End‑to‑end traces, service maps, eBPF, cross‑product correlation ✨ | ★★★★☆ Mature, rich UI (steep learning curve) | 💰 Host tiers + add‑ons — can grow costly | 👥 Cloud‑native, microservices teams | 🏆 Broad integrations + deep profiling for faster troubleshooting |
| New Relic | One platform (50+ caps), guided onboarding, default dashboards ✨ | ★★★★☆ Very usable for startups | 💰 Free 100GB/mo + usage‑based — needs governance | 👥 Startups, SMBs seeking quick setup | 🏆 Rapid onboarding and in‑product spend alerts |
| Dynatrace | Smartscape topology, Davis AI correlation, Grail lakehouse ✨ | ★★★★☆ Powerful AI insight (enterprise depth) | 💰 Hourly rate card — transparent but enterprise‑oriented | 👥 Large enterprises, complex Kubernetes estates | 🏆 Best‑in‑class AI root‑cause & automatic topology mapping |
| Cisco AppDynamics | Business transaction analytics, deep backend/SAP visibility ✨ | ★★★★☆ Enterprise‑grade UX (heavier UI) | 💰 Per‑CPU‑core pricing — predictable for VMs | 👥 Enterprises, SAP/database‑centric orgs | 🏆 Business‑level transaction correlation for ops→Biz alignment |
| Elastic Observability | Ingest/retention pricing, SLOs, ML/AIOps, flexible deployment ✨ | ★★★★☆ Powerful but KQL/stack ramp required | 💰 Cost‑efficient at scale with active governance | 👥 Teams needing flexible deploys (self‑managed → cloud) | 🏆 Serverless/self‑hosted options + managed LLM workflows |
| Sentry (PM/Tracing) | Error + distributed tracing, session replay, profiling ✨ | ★★★★★ Developer‑friendly, fast to adopt | 💰 Clear low‑entry, pay‑as‑you‑go options | 👥 Indie devs, startups, product teams | 🏆 Actionable issue workflow + CI/Git integrations for rapid fixes |
| Splunk Observability Cloud | SignalFx tracing, high‑volume metrics, multi‑region support ✨ | ★★★★☆ Mature at scale (complex estate UI) | 💰 Host or usage models — sales often needed | 👥 High‑throughput enterprises, regulated orgs | 🏆 Multi‑region/realm support and enterprise entitlements |
| Grafana Cloud | Open‑source stack (Mimir/Loki/Tempo), OTel‑first ingest ✨ | ★★★★☆ Transparent, friendly free tier | 💰 Granular, published usage pricing + free tier | 👥 OSS advocates, teams avoiding vendor lock-in | 🏆 Open‑standards + transparent per‑GB pricing for control |
| AWS X‑Ray | AWS‑native tracing, CloudWatch integration, sampling ✨ | ★★★★☆ Low friction on AWS | 💰 Per‑trace pay‑as‑you‑go — cost‑effective at modest volumes | 👥 AWS‑centric applications | 🏆 Native integration with AWS ecosystem for fast setup |
| Azure Application Insights | Workspace KQL analytics, availability tests, RBAC ✨ | ★★★★☆ Deep Azure integration (familiar to Azure teams) | 💰 Ingest/retention with commitment tiers — budgetable | 👥 Azure & hybrid enterprises | 🏆 Strong governance, RBAC and dev tool integrations |
| Google Cloud Ops | Cloud Trace/Logging/Monitoring, GKE & Prometheus support ✨ | ★★★★☆ Clean GCP integration, split UIs across products | 💰 Very low tracing cost + generous free allotments | 👥 GCP‑native teams, GKE workloads | 🏆 Cost‑efficient tracing with native GKE/Prometheus ties |
| IBM Instana | Automated discovery, 1s granularity, end‑to‑end tracing ✨ | ★★★★☆ Predictable UX, strong automation | 💰 Per‑MVS predictable pricing, minimums apply | 👥 Complex cloud/container & on‑prem estates | 🏆 One‑second granularity + unlimited apps/users in license |
Beyond Monitoring: Turning Performance Insights into Action
Navigating the landscape of application performance monitoring tools can feel overwhelming, but making an informed choice is the foundational step toward building a resilient, high-performing digital product. We've explored a dozen of the industry's top contenders, from comprehensive observability platforms like Datadog and Dynatrace to cloud-native solutions like AWS X-Ray and Azure Application Insights, and developer-focused tools like Sentry. Each offers a unique blend of features, pricing models, and ideal use cases tailored to different organizational needs, scales, and technical stacks. The sheer variety ensures that there is a fitting solution for nearly any scenario.
The core takeaway is that no single APM tool is universally "the best." The right choice hinges entirely on your specific context. A solo developer building an MVP might find immense value in Grafana Cloud's generous free tier and flexibility, while a large enterprise with complex, hybrid-cloud environments might require the AI-driven automation and root cause analysis capabilities of a tool like Dynatrace or AppDynamics. Similarly, teams deeply embedded in the AWS ecosystem will naturally gravitate toward X-Ray for its seamless integration, just as those building on Azure will find Application Insights to be a native fit. Choosing a tool is a strategic decision that reflects your technical architecture, operational maturity, and business priorities.
Recapping Your Decision Framework
As you move from evaluation to implementation, distill your decision-making process down to a few critical questions. This strategic approach ensures you select a tool that not only solves today's problems but also scales with your future ambitions. A well-chosen tool grows with you, whereas a poor choice can become a bottleneck.
- What is your primary goal? Are you focused on proactive error detection (like Sentry), deep-dive transaction tracing for microservices (like Instana), or a unified view of logs, metrics, and traces (like New Relic or Splunk)? Define your most pressing pain point first.
- What is your budget and team size? Startups and small teams should carefully evaluate usage-based pricing models and the total cost of ownership. Tools with steep learning curves may require dedicated personnel, adding to the overall investment.
- How complex is your environment? A monolithic application has vastly different monitoring needs than a distributed system running on Kubernetes across multiple clouds. Your tool must match your architectural complexity.
From Insight to Implementation: The Critical Next Step
Selecting and implementing one of these powerful application performance monitoring tools is a significant victory, but it marks the beginning, not the end, of your performance journey. These platforms are exceptional at diagnosing what is broken or slow and where the issue lies. They can pinpoint a sluggish database query, a memory leak in a specific service, or a high-latency API endpoint with incredible precision. The data they provide is the raw material for improvement.
However, the APM tool stops there. It provides the map but doesn't drive the car. The crucial next step is transforming that diagnostic data into tangible code improvements, infrastructure optimizations, and architectural refinements. This is where the real work begins: refactoring inefficient code, re-indexing database tables, optimizing resource allocation, and hardening security vulnerabilities identified through monitoring. Without this follow-through, the investment in APM yields little return.
This is the gap where many teams, especially startups, SMBs, and agencies, falter. Lacking specialized in-house expertise or the bandwidth to divert senior developers, critical performance insights can languish in a dashboard, turning into technical debt. The true value of monitoring is only realized when insights are converted into action. For teams looking to accelerate this cycle, bridging the divide between insight and execution is paramount. An effective APM strategy isn't just about finding problems; it's about fixing them swiftly and efficiently to ensure your application doesn't just launch but thrives under pressure, delivering a seamless experience to your users.
Ready to turn your performance data into decisive action? Vibe Connect bridges the gap between monitoring insights and expert implementation. Our platform analyzes your performance bottlenecks and connects you with elite, on-demand developers to execute the precise code refactors, database optimizations, and security hardening your application needs to scale. Stop letting performance issues sit in a backlog and start shipping improvements today with Vibe Connect.